Help needed to solve range bar problem

#41
Simply try AB 5.5. Why using Multicharts when Multicharts doesn't display correct range bars (different sizes of bars in your pictures)? In Amibroker 5.50 there was done a new fix and it is a completely correct display of range bars now. So you don't need Multicharts or Tradestation. They are inferior anyway.

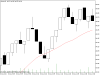
Have you tried 5.50? http://www.amibroker.com/devlog/2011/12/13/amibroker-5-50-1-rc1-released/ Below is a sample pic using tick data (not 1 minute data). Would you agree that it is correct? take a ruler and check.
Thanks for the charts... the charts look good. it would be really nice of you if you could post some charts of the stocks listed in the nse futures or cash.

Also can you please mention the data source for nse stocks and futures from where you are getting the tick data
 
#43
Thanks for the charts... the charts look good. it would be really nice of you if you could post some charts of the stocks listed in the nse futures or cash.

Also can you please mention the data source for nse stocks and futures from where you are getting the tick data
Just get proper data feed bro, ur purpose will be solved :)
 
#44
I don't use Indian market as I'm not an Indian. So I'm not interested in it. Maybe someone else can help you regarding that.
I suggest a good eye specialist if you dont see equal range bars in MC.

By the way how old are you 13 or 14 ?

The difference between a genius and stupid is that a genius knows where to stop . I hope you do.

Take care and best of luck with your trading.
 
#45
=============

What is level 2 data ? do we have level 1 data too ? how many levels of data do we have ? what are the advantages of various levels of data ?

Could you please share ?

=============
level 2 data includes asks and bids .It helps you in volume based studies like volume delta, bid-ask avol, bid X ask , percenage vol,etc .
 
#47
How much does this cost and if this data is plotting every trade then y r there mistakes in the range bar in the chat you posted.

Here is the chart you posted
http://imageshack.us/photo/my-images/406/miniftyesignal.png/

Again because of the limitations in the charting software. I have also posted a 10 range bar chart from Market Delta which is even worse than Amibroker chart. The data is E signal.
http://imageshack.us/f/26/83554424.png/


MC charts correct range bars even from data from ODIN

http://imageshack.us/photo/my-images/845/sbinudde.png/

Also Ami that I had used was 5.4.

I suggest try everything., pick what you think is right and leave the rest.
Too much of it creates confusion
 
#48
Again because of the limitations in the charting software. I have also posted a 10 range bar chart from Market Delta which is even worse than Amibroker chart. The data is E signal.
http://imageshack.us/f/26/83554424.png/


MC charts correct range bars even from data from ODIN

http://imageshack.us/photo/my-images/845/sbinudde.png/

Also Ami that I had used was 5.4.

I suggest try everything., pick what you think is right and leave the rest.
Too much of it creates confusion

I have attached a screenshot of the fxcentral(autometatrading.com) range bar chart from metatrader for today(1 rupee range). They seem to be giving the most decent data at this point.

By the way how much does esignal data cost.

I am on the trial version with autometatrading now. I have a expert advisor which, when run on one minute charts gives me range bars in offline mode.
 

Attachments

Similar threads