


I was reluctant to contribute again because I wanted to avoid an argument with the genius of detwo.
Anyways pehaps this is what you are lookin for
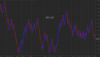
http://imageshack.us/photo/my-images/845/sbinudde.png/
This data is in tick format (not real tick) downloaded from ODIN and displays range bars correctly. I used to download from ODIN before I subscribed for Esignal.
Again I repeat use Multicharts or Tradestation 8.2 or above if you want to trade rangebars. Multicharts is nothing but a replica of Tradestaion and is also lighter on computer
Many softwares do not plot the rangebars correctly. These bugs perhaps will get corrected in future releases.
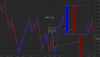
Here again I have plotted SBIN 10 Rangebars with Esignal data and the result is even poorer than Amibroker.
http://imageshack.us/f/26/83554424.png/
Market Delta again is not a crap for people who use market profile or Volume Delta for their studies
Try trading range bars with 21 TMA and 21 WMA.
Happy Trading
Anyways pehaps this is what you are lookin for
http://imageshack.us/photo/my-images/845/sbinudde.png/
This data is in tick format (not real tick) downloaded from ODIN and displays range bars correctly. I used to download from ODIN before I subscribed for Esignal.
Again I repeat use Multicharts or Tradestation 8.2 or above if you want to trade rangebars. Multicharts is nothing but a replica of Tradestaion and is also lighter on computer
Many softwares do not plot the rangebars correctly. These bugs perhaps will get corrected in future releases.
Here again I have plotted SBIN 10 Rangebars with Esignal data and the result is even poorer than Amibroker.
http://imageshack.us/f/26/83554424.png/
Market Delta again is not a crap for people who use market profile or Volume Delta for their studies
Try trading range bars with 21 TMA and 21 WMA.
Happy Trading
")