DEAR AW 10 THANKS A LOT FOR DEVOTING UR PRECIOUS TIME AND SO MINUTELY EXAMINING MY SYSTEM RESULTS AND PRESENTING UR VIEWS OVER THAT WE NEED UR KIND OF PEOPLE IN THIS THREAD TO MAKE RESULTS MORE PRECISE ACCURATE AND EARNING .
UR OBSERVATIONS ARE FANTASTIC AND QUESTIONS REASONABLE
HERE IN THIS POST I M ATTEMPTING TO ANSWER ALL YOUR AND OTHER PEOPLE DOUBTS AND QUERIES ABOUT IT
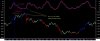
(ADX) evaluate the strength of a current trend, be it up or down. It's important to determine whether the market is trending or trading (moving sideways), because certain indicators give more useful results depending on the market doing one or the other.
The ADX is an oscillator that fluctuates between 0 and 100. Even though the scale is from 0 to 100, readings above 60 are relatively rare. Low readings, below 20, indicate a weak trend and high readings, above 40, indicate a strong trend. The indicator does not grade the trend as bullish or bearish, but merely assesses the strength of the current trend. A reading above 40 can indicate a strong downtrend as well as a strong uptrend.
ADX can also be used to identify potential changes in a market from trending to non-trending. When ADX begins to strengthen from below 20 and moves above 20, it is a sign that the trading range is ending and a trend is developing.
Moving averages are the average of past data of any particular data series it moves slower to the main movement and therefore provides room to the main data series to fluctuate above/below it , as long as base indicator or data series move faster than moving average its ok ! but when the main data series starts slowing down(in case data series is above moving average ) both comes closer and finally cuts it .the main data series moves downward faster and goes below it then it is assumed as long as the main data series is below it will fall and when it again cuts it will go higher .
this is something what we all know about ADX and MOVING AVERAGES
NOW LETS TALK ABOUT THIS SYSTEM
1. ENTRY : HERE ONE THING I WILL LIKE TO TELL EVERY ONE, THIS SYSTEM HAS TO DO NOTHING WITH 313 CROSSOVER
2. IT ONLY GETS DIRECTION FROM 313EMA CROSSOVER AS THIS IS A VERY FAST PATTERN FOR GETTING INTO THE MARKET DIRECTION
3. TRADE THE TRENDS THATS THE PUNCHLINE OF THIS SYSTEM
4. WE HAVE TO DO NOTHING WITH POSITION OF ADX
5. ITS IS A UNIVERSAL TRUTH THAT ADX LINE WILL ALWAYS BE FASTER THAN ITS 9SMA
6. WHEN ANYTREND STARTS WHETHER SHORT TERM OR LONG TERM ADX WILL RISE AND CUT 9SMA FROM DOWNSIDE BECAUSE EITHER A BULL MARKET OR THE BEAR ADX ONLY KNOWS RISING (FOR A TREND BULL OR BEAR )
7. WHEN ADX WILL FALL THE TREND FALLS , IF IN A BULL /BEAR MARKET IF PRICE ACTION IS AGAINST ADX I, TREND IS FALSE AND IT HAS SHORT LIFE.
8. SO IF WE START IN THE BEGINNING OF A TREND AND LEAVE IT WHEN IT HAS CHANCES OF WEEKENING OR RE ENTER WHEN IT CORRECTS .
9. WE ARE ALWAYS ON THE WINNING SIDE
THEORY OF SYSTEM
WHEN TREND TAKES BIRTH ADX STARTS RISING AFTER IT IS LITTLE BIT DIRECTIONAL IT WOULD CUT 9SMA
WE CHECK FOR DIRECTION 313 EMA CROSSOVER CONFIRMS DIRECTION AND PROVIDE STRENGTH TO OUR DECISION
WE COME AND TAKE OUR POSITION AND WAIT UNTILL TREND PERSISTS .
I HAVE AVOIDED STOPLOSSES AS THE SYSTEM ALLREADY USES FAST INDICATORS
U CAN ANALYSE OR PAPER TRADE, U WOULD FIND WHENEVER IN A TRENDY MARKET
IF A SIGNIFICANT LEVEL IS BREACHED ADX WOULD CUT ITS RATHER FAST 9SMA
9SMA IS A FAST MA AND THEREFORE I HAVE USED IT , PROVIDES PROTECTION TO TRADERS POSITION ACTING AS A STOPLOSS
TRENDY MARKETS ARE THE GAMES OF BIG MARKET PLAYERS AND ARE DRIVEN BY SO CALLED STRONG HANDS (DAW THEORY ) THEY(SMART INVESTORS , BROKERS ,INSTITUTIONLAL BUYERS, FUND MANAGERS ) RUN THIS SYSTEM AND THE USE ALL SHORT OF TACTICS SUCH AS ( 10-15)% (HIGH LOW) OR FALL ON INTRADAY BASIS , UR PROFIT BOOKING OR STOPLOSS GETS TRIGGERED ,U HAVE BURNT UR DUMP MONEY AND MARKET CLOSES (1-2)% HIGHER OR LOWER AND EVERY THING BECOMES ALRIGHT FROM NEXT DAY .
A
ND U R LEFT WITH THE LOSSES AGAIN
MY FRIEND THINK OVER DIFFERENCE, THIS SYSTEM DO NOT GIVE U SIGNALS EVERY EVENING U MAY HAVE TO WAIT FOR EVEN 5-6 MONTHS BECAUSE SYSTEM TRADES ONLY TRENDS AND IT HAS TO DO NOTHING WITH THE NORMAL MARKET UP DOWN MOVEMENTS .
{n selecting the trades, u have been a bit choosy and ended up picking up only big visible trades}
THATS THE KEY MY FRIEND U NEED TO BE RATIONAL TO TAKE GOOD DECISION IF U USE ,SAME GLASS TO VIEW EVERY THING U R NEVER GOING BE A WINNER
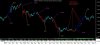
HERE I M POSTIN A CHART WITH AN EXAMPLE , FOR UR CLARIFICATION ,WHICH TRADE I PICKED .
AND WHY
{4) In system design, we need to konw the important parameters like win %, loss %, average win size, average loss size, maximum consecutive loosing trades, biggest drawdown for open trade etc.
In absence of that we might never know our system well enough to trust it.. and obey each and every signal to the dot (maybe thats what happend with u when exited the winning trade early).}
U OPEN METASTOCK ENHANCED SYSTEM TESTOR
CLICK ON NEW SYSTEMS NAME IT
WRITE DOWN
BUY FORMULA
Mov(CLOSE,3,EXPONENTIAL)>Mov(CLOSE,13,EXPONENTIAL) AND (ADX(14)>Mov((ADX(14)),9,SIMPLE) )
THEN SELL
CROSS( ADX(14)>15 ,ADX(14)>Mov((ADX(14)),9,SIMPLE))
THEN SELL SHORT
Mov(CLOSE,13,EXPONENTIAL)>Mov(CLOSE,3,EXPONENTIAL) AND (ADX(14)>Mov((ADX(14)),9,SIMPLE) AND ADX(14)>15)
THEN BUY TO COVER ORDER
CROSS( ADX(14)>15 ,ADX(14)>Mov((ADX(14)),9,SIMPLE))
ADD NEW SIMULATION TEST, SCRIPTS AND INDICES AND GET THE RESULTS ABOUT
win %, loss %, average win size, average loss size, maximum consecutive loosing trades, biggest drawdown for open trade etc.
OR WHATEVER U WANT
PLEASE HELP ME TO IMPROVE IT AS (THIS PROJECT IS UNDER DOVELOPMENT)BY WAY OF UR SUGGESTIONS AND COMMENTS .
LOOKING FORWARD FOR UR HELP AND SUGGESTIONS
HAPPY TRADING
ABHI


 66.3 KB Views: 645