


Stocks To Keep A Close Eye On - Chapter II
- Thread starter SavantGarde
- Start date
- Tags bse buy medium term investing nse sell shares short term investing
- Status
- Not open for further replies.
Dear Anant
yesterday i downloaded EOD in usual way and got a extra day of EOD, which is for day 20/10/2015. obviously something went wrong while downloading.
problem is i am unable to delete these quotes(which are present for all symbols)
can u suggest remedy?
because of this extra quote i am getting wrong signals!!!
regards,
Attachments
-
 91.1 KB Views: 295
Sorry boss i have tried it out>here is the afl i have downloaded.Please help me out.
The afl is as follows:
_SECTION_BEGIN("SingleMAwithBB");
SetChartOptions(0, chartShowDates | chartWrapTitle);
...
...
...
...
for(i = 1; i < BarCount; i++)
{
if(Bought AND NOT Buy)
{
SL = Max(SL, SL[i - 1]);
if(C[i - 1] >= 0.9999 * NextTgt[i - 1]) NextTgt = Tgt[i - 1];
NextTgt = Max(NextTgt, NextTgt[i - 1]);
}
}
BuyDate = ValueWhen(Buy, Ref(DateTime(), 1), 1);
BuyPrice = ValueWhen(Buy, Ref(MeanPrice, 1), 1);
SellPrice = ValueWhen(Sell, Ref(MeanPrice, 1), 1);
TgtReached = IIf(Bought AND NOT Buy AND C >= 0.9999 * NextTgt, True, False);
SLHit = IIf(Bought AND NOT Buy AND C < SL, True, False);
SLHit = ExRem(SLHit, Buy);
//
if(TgtReached[BarCount - 1]) NextTgt[BarCount - 1] = 2 * H[BarCount -1] - SL[BarCount - 1];
//
BTopPierce = IIf((Ref(H, -1) >= Ref(BBTop, -1) AND Ref(GreenBar, -1)) AND (H < BBTop AND L > BBBot AND RedBar), True, False);
BBotPierce = IIf((Ref(L, -1) <= Ref(BBBot, -1) AND Ref(RedBar, -1)) AND (L > BBBot AND H < BBTop AND GreenBar), True, False);
if(Status("action") == actionIndicator)
{
...
...
...
...
_SECTION_END();
Hi Robin,
What you are using is old version. In the above quoted text I have marked the place where the new version differs. I have marked the additional lines to be added in red. The red colored lines are to be added between the blue colored lines. Nothing to delete. Make the changes and plot the chart again.
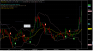
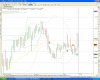
I have marked with pink circle in the image below where the target reached and next target are displayed on chart.

-Anant
Dear Anant
yesterday i downloaded EOD in usual way and got a extra day of EOD, which is for day 20/10/2015. obviously something went wrong while downloading.
problem is i am unable to delete these quotes(which are present for all symbols)
can u suggest remedy?
because of this extra quote i am getting wrong signals!!!
regards,
yesterday i downloaded EOD in usual way and got a extra day of EOD, which is for day 20/10/2015. obviously something went wrong while downloading.
problem is i am unable to delete these quotes(which are present for all symbols)
can u suggest remedy?
because of this extra quote i am getting wrong signals!!!
regards,
If this error is for some of the symbols, you have to delete the quote for each symbol one by one where the quote is wrong. If it has happened for all quotes in your database Then follow the procedure below:
Go to 'Symbol-Quote Editor' from the menu bar. In quote editor, select All Symbols (Top left side). wait for all symbols to be loaded. In the Box labelled 'Date' on the left side, Change the date to the required value (the wrong date). Again wait for all quote to be loaded. Then click the 'Delete' button in the bottom. All the quotes for that wrong date will be deleted. Close the quote editor. If you have the corrected EOD data file, load it again by importing the file.
-Anant
Jai Baba
Geeta,
1) CMP Stands For Current Market Price
2) BUY @ Price Is Usually The High Of Previous Day But Not Always
3) Quantities Mentioned Is Based On Approximately 1-2% Risk Per Scrip, It Is Usually 1% Based On Total Capital Base Of 25K
4) Yes, One Will Normally Have Some Capital Balance So That One Can Enter Future BUY Triggers That May Be Posted.
5) If Your Total Available Capital Is 50K Then All One Needs To Do Is Double The Recommended Quantity.
Happy & Safer Investing
SavantGarde
Savant Ji
Jai BABA
I'm veery new student of trader ji
Thanks for your advice.
Could you please let me know what d'you mean by (CMP Rs...@ Rs...)
secondlythe above numbers only amounts to much less than Rs 25000/-.
I may be doing something wrong
Is it?
Kindly advice, if possible
Kind regards
Geeta
Jai BABA
I'm veery new student of trader ji
Thanks for your advice.
Could you please let me know what d'you mean by (CMP Rs...@ Rs...)
secondlythe above numbers only amounts to much less than Rs 25000/-.
I may be doing something wrong
Is it?
Kindly advice, if possible
Kind regards
Geeta
Hi,
NEW TRIGGERS on 19-01-2010 (For Trading on 20-01-2010):
BUY TRIGGERS
SELL TRIGGERS
TARGETS REACHED
STOP LOSS HIT
TRADE THESE SIGNALS AT YOUR OWN RISK
The updated Excel file is available for DOWNLOAD HERE
-Anant
NEW TRIGGERS on 19-01-2010 (For Trading on 20-01-2010):
BUY TRIGGERS
Code:
-------------------------------------------
Symbol     | C. M. P.|  Target | StopLoss |
-----------|---------|---------|----------|
ANDHRABANK |  112.20 |  121.50 |  104.20  |
ICICIBANK  |  865.50 |  930.35 |  821.65  |
ORIENTBANK |  259.75 |  278.40 |  253.20  |
-------------------------------------------
Code:
--------------------------------------------------------------------------
Symbol     | Buy Date |  Price  |  Target | StopLoss |  C.M.P. | P / L %
-----------|----------|---------|---------|----------|---------|----------
ZYLOG      | 29-12-09 |  361.60 |  388.60 |   341.40 |  348.70 |  -3.6 %
           |          |         |         |          |         |
--------------------------------------------------------------------------
Code:
Symbol     | Buy Date |  Price  |  Target | StopLoss |  C.M.P. | P / L %
-----------|----------|---------|---------|----------|---------|----------
           |          |         |         |          |         |       %
--------------------------------------------------------------------------
STOP LOSS HIT
Code:
Symbol     | Buy Date |  Price  |  Target | StopLoss |  C.M.P. | P / L %
-----------|----------|---------|---------|----------|---------|----------
           |          |         |         |          |         |        %
---------------------------------------------------------------------------
TRADE THESE SIGNALS AT YOUR OWN RISK
The updated Excel file is available for DOWNLOAD HERE
-Anant
Hi Friends,
Updates based on EOD of 18-01-2010:
TARGET REACHED
Next Target for the above will be given by Savantji
STOP LOSS HIT
The updated Excel file is available here.
Regards
*** Uma ***
Updates based on EOD of 18-01-2010:
TARGET REACHED
Code:
SYMBOL     | Buy Date |  Price  |  TARGET | STOPLOSS |  C.M.P. | P / L %
--------------------------------------------------------------------------
FINANTECH  | 23-11-09 | 1408.05 | 1659.90 | 1156.20  | 1682.80 |  19.51%
FINANTECHT | 26-11-09 | 1396.25 | 1663.80 | 1156.20  | 1682.80 |  20.52%
GEOMETRIC  | 10-11-09 |   49.90 |   75.55 |   50.10  |   76.25 |  52.81%
GEOMETRIC  | 30-11-09 |   54.00 |   75.55 |   50.10  |   76.25 |  41.20%
GUJFLUORO  | 29-12-09 |  131.50 |  174.05 |  125.95  |  182.30 |  38.63%
HCC        | 28-05-09 |  109.35 |  157.90 |  107.05  |  160.65 |  49.61%
KARURVYSYA | 11-01-10 |  392.40 |  414.25 |  370.55  |  414.35 |   5.59%
--------------------------------------------------------------------------STOP LOSS HIT
Code:
SYMBOL     | Buy Date |  Price  |  TARGET | STOPLOSS |  C.M.P. | P / L %
--------------------------------------------------------------------------
    NO     |   STOP   |  LOSS   |   HIT   |  TODAY   |         |       %
--------------------------------------------------------------------------
The updated Excel file is available here.
Regards
*** Uma ***
- Status
- Not open for further replies.
Similar threads
-
 to keep record of stocks i will be following
- Started by Gandhar.
- Replies: 5
-
-
-

-
Is it ok to buy Stocks keeping the current market scenarios in mind or should I wait
- Started by greg4u
- Replies: 10