hi @DSM
sorry for the delay
here it is , since you gave me the new info about your trader friends setup , i must tell you its almost next to impossible as of now to identify what exactly he does in only 2 days of intarday chart , after identifying high low of 2 days and applying fibonacci on that , you know its very very discretionary in nature , and since the guy trades 30 lots for that means he is very very experienced guy , so that even makes it hard to guess , what i can tell you about fibo is how that works in principal .
markets are always in motion , all intarday movement is not any random event , i will prove it to you right here in my post , whatever level markets are today is because of all previous historical movements
all intraday movements are extention of all previous intraday movements , which in turn are all extention of previous daily chart movement which makes daily charts and inturn makes weekly charts
now markets tends to take supports/resistance of fibo levels based on its importance (whatever the basis of importance of a level is a huge matter of discussion and we cannot get into that , but we know markets has its own minds ,it will take support and resistance where it has to)
most important fibo levels your friend told you are almost right , but let me tell mine , levels are 23%.38.2,61.8,76, and 127% and 161.8%
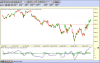
lets see some charts
its daily chart of nifty from 2008 -2010 , all alphabets are moves on upside and all % retracements are the fibo levels of that particular move in alphabets , 50% is also a fibo retracement however i do not give any importance to it .
there is no exception to the retracement , markets always always always take retracement based on the important lows and highs , what level will markets decide as important only markets know , it can be predicted but not 100%
more to follow
cheers


 41.6 KB Views: 223


")

