The Crash( 17.5.2006) and FII activities since then

Status
Not open for further replies.

pkjha30

Well-Known Member
srisara said:
Waiting to remit 2$ billion. anyone ready to invest wisely on my behalf? :D

just kidding, mine is not even a drop in this Ocean. :)

Satya
Hi Satya
Ocean is made of all such tiny drops. Don't underestimate the power of little sums. Together they constitute substantial amount .

If dollar is strong you get less rupee for each dollar. So you wait till dollar weakens. Similar thinking people wait. Thus remittances are reduced. I just told czar that unless satya and srini and lakhs of them collectively called Pravasi Bharatiya remit forex will be little less though expenses in forex will continue since RIs( resident indians) don't stop consuming.

There are many brokers who would like your money to come. They minted both ways while investors are broke .You wait and watch and let market decide its course before trading.

pankaj:)
 

pkjha30

Well-Known Member
jdm said:
same as we find in arithmetic scale. the script value doesnt changes. but how those values are plotted in the graph, thats changes.
Then better take the value on normal scale. That may be more reflective of actual position.
Pankaj:)
 

jdm

Well-Known Member
pkjha30 said:
Then better take the value on normal scale. That may be more reflective of actual position.
Pankaj:)
semi log is helpful while drawing trendlines.

but its most helpful when you are analysing something in excess of ten years or so, where the spread in the y axis, i.e. the price, is usually big, and its true for almost any script.

take the sensex for example. on arithmetic scale, data during the eighties means nothing. just a horizontal straight line. while the data for last 3 years is almost a vertical straight line. and a frightening one too.

semi log, as you said, "smoothen things".

and for shorter time frame the difference between the two is negligible, unless theres a great price fluctuation.
 

Attachments

pkjha30

Well-Known Member
jdm said:
semi log is helpful while drawing trendlines.

but its most helpful when you are analysing something in excess of ten years or so, where the spread in the y axis, i.e. the price, is usually big, and its true for almost any script.

take the sensex for example. on arithmetic scale, data during the eighties means nothing. just a horizontal straight line. while the data for last 3 years is almost a vertical straight line. and a frightening one too.

semi log, as you said, "smoothen things".

and for shorter time frame the difference between the two is negligible, unless theres a great price fluctuation.
Hi jdm

Not to join issue with you.

But when things are smoothened people who are euphoric tend to get delirious on unabated rise without realising that it is unsustainable. When we see normal scale we tend to get frightened and then think if it is really reflecting the growth or if it is sustainable. But then that is what analyst tend to hide from us. And need to be careful.
pankaj:)
 
I have posted one reply about two hours ago. I have clicked submit reply. But it has never appeared in the forum. I donot know what happened and why it has happened. Similarly I dont know where the problem is. I have not retained the draft of the said reply also. That is why I am constrained to post this reply.

pkjha30 said:
Dear munchi

After a while you feel like analyst and want to make a statement that looks like real pro.:D

Never. I have never ever regarded myself as an analyst and I have never ever thought that I am an analyst. I have always regarded myself as a student of these markets and I shall remain so in future until my last breath. These markets are great levellers. If I ever think that I am an analyst or master of these markets, they will bring me to the ground very quickly. I have always kept this fact in mind. For your kind information, in almost all the posts I have made here I have always made it a point to mention that better answers are welcome or that if I am wrong please correct me. You may have a doubt now. Why I am posting these letters here if donot know? That is to share whatever I have learned from this Forum or from somewhere else and also some of the results of so called my observations with some members who have not learned or obsered it. Another intention behind all these postings is to correct myself, if I have learned anything wrong or if I have observed anything wrong. Intention is to learn still more if some one else knows more than what I already know.

Flattery never helps. On the contrary it damages a lot. I rarely post a letter of flattery because it helps none. It unnecessarily wastes web page space.

I never intended to cause anger, hurt or annoy you or anyone else. In fact, while posting my original reply (to which you have responded and which I am quoting in this post), I had sensed the danger of angering you. That is why I pleaded to take my post in a lighter vein. Just see the effect of slight tickling done by me. Now I have learned one trick that can be done with the help of MIG planes.:D

On a more serious note, there may be some more members (like me) who may not understand the complicated language and complicated technicals/ jargons. Who is a great teacher? It is not a person who has vast knowledge about the subject and keeps it with himself and goes to the graveyard taking it along with him but it is a person who explains every aspect of the subject in a simple language that can be understood by all. Many of the members of this forum may not express their difficulties in the open due to various reasons. Just see the effect of the simple language explanation given by you. Some members responded immediately by posting some wonderful charts and the discussion on the subject has taken a wonderful turn that too for the better. Perhaps you too have cleared some doubts from some other members. I have cleared a lot of doubts and got some more.:D You redicule me, bully me, get angry with me, I will never ever mind. My intention is to learn more and more and I will constantly trouble you and other learned members of this forum in my own style.

Thanks again for giving various extensions of KISS. I intended Keep It Small and Scalable. KISS is always sweet. It expresses love and happiness.

Never trust these MIG planes. They often crash and more often than not they kill passengers and pilot on board.:D

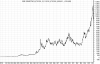
I will be greatful to you if you can explain exponential curves and its relation in stock/stock market analysis. I have not studied anything in this regard.

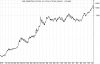
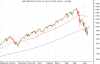
On seeing the charts posted by JDM, I have got a question to learned members of this forum who have specialised on elliott waves (including Sri. Vinay (joy_verma)). I am eagerly studying various aspects of elliott waves. Is the sensex undergoing fourth wave now?
 
C

Czar

Guest
jdm said:
semi log is helpful while drawing trendlines.

but its most helpful when you are analysing something in excess of ten years or so, where the spread in the y axis, i.e. the price, is usually big, and its true for almost any script.

take the sensex for example. on arithmetic scale, data during the eighties means nothing. just a horizontal straight line. while the data for last 3 years is almost a vertical straight line. and a frightening one too.

semi log, as you said, "smoothen things".

and for shorter time frame the difference between the two is negligible, unless theres a great price fluctuation.
Darn seeing all 3 charts why do I feel all of them are indiacating a possibility of 7700 after which a 3 months rally to 10 K & back further... :eek:
 

pkjha30

Well-Known Member
Hi Munchi

Take that in lighter vein. You have produced such a long reply. Oh dear still you mistake me for an analyst. I am just ordinary investor with his investment on the block.

I am a fan of Norman lewis. In one place he has given a table with three columns each having 10 words. You think a number and corresponding words are made into a quite complicated conveying unintelligiblly complex:D things even writer would not be able to make meaning of.
That is part of Manual of American bureaucracy. That what got into me and I produced such a beautiful sentence and see the result. So much happened. never intended.

And did I get angry. Nah, except one type ,which is only to enjoy, I didn't know the other meaning of kiss. So I thought to tickle you. See how you have given a long reply.


However , I have commited a mistake by writing complex sentence so now I have to suffer my own stupidity and explain in brief what is exponential

Exponential Equation is y=e^x E=euler number and is equal to 2.71828 approx.
The variable x in the equation is called the 'exponent', the function is called the exponential function. The oldest exponential series is: 1, 2, 4, 8 and so on. There is an old legend about a scholar who could choose his own reward for some job. He asked to place grains of corn on a chess board, starting with one, on each field the double amount of the former...

With the Euler number e 1) as base of the power, the function is the natural exponential function exp(x), sometimes abbreviated as exponential function. For other values of the base of the power the function is a general exponential function.

The inverse of the exponential function is the logarithmic function or logarithm. This general logarithm is written as y = a log(x) or y = loga(x).

Difference in the curves drawn by log scale and exponential scale will be quite extraordinary.

Sometimes it is advantageous to plot the log of y against x. This is known as a semi-log graph. Semi-log graphs are commonly used in many diverse fields, including engineering, chemistry, physics, biology, and economics. A semi-log graph are used for two reasons:- The range of values can be much greater, spanning several orders of magnitude (several powers of 10). Second reason is that the exponential equation:y=ae^delta-x will result in straight line up graph.
See attached examples for chart. Don't ask more questions on curves else you will risk making me a real pro. Jai google ha ha ha ha


For further discussion on stock charts head straight to
http://www.fool.com/foolfaq/foolfaqcharts.htm No kidding.:D

Pankaj:)
 
Last edited:
Status
Not open for further replies.
Thread starter Similar threads Forum Replies Date
T Equities 21

Similar threads