Pride's Intra-Day Strategy [Profit Everyday]

Status
Not open for further replies.

Revati

Active Member
the button is 4th from top right. next to 5 min drop down. when you click on this, it will show a drop-down with time frame from 1 day to 1 year. but i tried this option, it didnt work, but i remember it worked when i used it some 6 months back.
Ankit/Bandlab,


1. Button next to 5min drop down is the timeframe settings button.

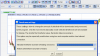
2. You need to save the new setting by pressing "Save Preferences" button
(2nd from bottom left - The one with floppy drive icon).

Attached images show the two settings. Now just icharts settings does not help, we need to additional steps mentioned in step 3 below.

3. After this close the icharts window. Follow the internet explorer clear the history (Tools -> Internet options - >Clear History button). (other browsers menu would be different)

Thanks,
Revati
 

Attachments

.Pride.

Well-Known Member
ankit, %d is 3 and slowing is 4.

keep MA method as simple, because I think exponential will make the crossovers lag a bit. I don't have metastock though, so can't confirm.

and as mentioned by Savant, use 'close' as price field.

but as you are trying this on forex, try all settings to see which ones work best :)
 

humble

Well-Known Member
Sri, a worthy idea, but that system will definately not be the Pride's system. The use of higher TF Stoch along with Lower Tf helps in keeping out of trading markets .
A different thread will not be a bad idea, to experiment and test the hourly trades. Do take a look at ST's thread: How to trade an oscillator. He has posted an hourly chart to explain and could be helpful in the new thread.

I am in for your suggestion.

Dear Sri,

this is a great idea and even I was contemplating this kind of modification so a new system can be made for positional trades. Just didn't get enough time to think it through.
It can act as a complementary system to the intra-day system as sometimes we miss out on the big moves with the current system. and as you said, it will be helpful for part-time traders as well.

I will try this for the "July 2009 Series" of MiniNifty Futures [MiniNifty follows Nifty futures 99.9% of the times] and will let you know the results and come up with a new thread when i feel i have the basic details :).

Regards,
-Sri
 

.Pride.

Well-Known Member
I will try this for the "July 2009 Series" of MiniNifty Futures [MiniNifty follows Nifty futures 99.9% of the times] and will let you know the results and come up with a new thread when i feel i have the basic details :).

Regards,
-Sri
but do keep in mind the daily stoch trend before taking a position with 60min charts.
always try to stay with the HTF trend.
 
Dear Pride,

May I know which chart software you are using (the example you quoted). Is it free? If so, the link please.Pls reply

Regards,

Veer
 

Satyen

Well-Known Member
Hello Satyen

You are correct %K needs 2 parameter, Where as % D will need 3


Stochastic %d parameter: period = 8, %k Avg = 3, % D avg = 4

stochastic %k parameter : period = 8, %k avg = 3

Just select the above values and you are done.

Thanks a lot Rajadhiraj

Regards
Satya
 

oxusmorouz

Well-Known Member
Hi Pride,
I'm enclosing the tradestation strategy backtest report for your strategy.
Code:
Code:
Inputs: K(8),DX(3),DX1(4),ContSize(50);
Variables: High1(0),Low1(0),Close1(0),Stoch(0),oFastK(0), oFastD(0), oSlowK(0), oSlowD(0),Stoch1(0), 
oFastK1(0), oFastD1(0), oSlowK1(0), oSlowD1(0),EMA(0),StopVal(0);

High1 = High of data2;
Low1 = Low of data2;
Close1 = Close of data2;

Stoch = Stochastic(High1, Low1, Close1, 8, 4, 3, 1, oFastK, oFastD, oSlowK, oSlowD);
Stoch1 = Stochastic(H,L,C,8,4,3,1,oFastK1, oFastD1, oSlowK1, oSlowD1);

If ofastk > oSlowD and oFastK1 > oSlowD1 and Xaverage(C,5) crosses over Xaverage(C,13) then
buy 50 shares next bar at market;

If L[1] < L[2] then
StopVal = C - L[1] else
stopval = C - L[2];

If oFastK1 crosses below oSlowD1 then sell contsize/2 shares next bar at open;
If MRO(ofastk > oSlowD and oFastK1 > oSlowD1 and Xaverage(C,5) crosses over Xaverage(C,13),20,1) 
> MRO(oFastK1 crosses below oSlowD1,20,1) then sell contsize/2 shares next bar at open;

setstopposition;
SetStopLoss(contsize*StopVal);

Can someone confirm if I've coded this right? Tested it from 2006. I've assumed a commission of Rs..75 per side.
 
Last edited:

jatayoo

Well-Known Member
Everyone is looking for the "magic formula"
camarilla, moving averages, woodies, trader's pivots, stochastics, RSI etc etc etc.
TRUTH IS
"Their is no one system that can beat the market all the time"
One has to think hard, adjust his parameters, and play the market to come up with a system that works for him and him alone.He becomes a part of the system.....an extention of it.
SO BE IT.
 

ag_fx

Well-Known Member
Hi Pride,
I'm enclosing the tradestation strategy backtest report for your strategy.

Can someone confirm if I've coded this right? Tested it from 2006. I've assumed a commission of Rs..75 per side.

I dont know wat you have done is correct or not...I cant even comment on the code.
I can just say one thing: You have been able to discover a gold mine of trading!!!

How?

Just swap your entry and exit signals in ur code....n then u will have an automated strategy making u a millionaire!!!:D


take it light heartedly...No harsh feelings..I am sure some some other guys like joy,humble etc can help u out with the code.

Happy Trading
 

.Pride.

Well-Known Member
"Their is no one system that can beat the market all the time"
One has to think hard, adjust his parameters, and play the market to come up
you are absolutely correct. but I feel that if a particular strategy has it's fundamentals correct, minor tweaking of parameters can ensure that we stay profitable even in different market conditions...

Hi Pride,
I'm enclosing the tradestation strategy backtest report for your strategy.

Can someone confirm if I've coded this right? Tested it from 2006. I've assumed a commission of Rs..75 per side.
buddy, I don't know what you have done, but trust me, since the day I have started using this strategy, my equity curve is the exact mirror image of what you have posted :)
 
Status
Not open for further replies.

Similar threads