


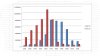
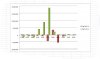
Today the option table is completely confusing. Attaching some OI & OI-change charts from excel.
http://www.traderji.com/attachment.php?attachmentid=18761&stc=1&d=13662
http://www.traderji.com/attachment.php?attachmentid=18762&stc=1&d=136626869168691
In particular how does one interpret 5700CE loosing 0.5million OI & 5700PE adding 2million OI?
MY reading:-
Bulls are confident of around 5660 holding.
Bears do not seem confident of 5743 holding - is it
a) insignificant change
or
b) end of series rollover to May? (may 5700Ce has added 0.6 million so I am thinking of this)
Attachments
-
 54.8 KB Views: 123
 -
 49.7 KB Views: 120