Nifty Futures Trading Part 2 (Positional)

Status
Not open for further replies.

columbus

Well-Known Member
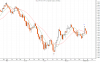
The 100 day EMA for Nifty Spot is around 4528 which should provide some stiff resistance. We can look to short around 4520 with a stop loss of 4540.

But if that breaks then the next resistance comes from the 200 day EMA which is around 4692. But I don't think this rally would get to 4600, so it is better to short around 4520, Nifty Spot.

Any suggestions?
Yes ,I agree with you 110-DMA level (5month-DMA) is placed at 4572 and could show some resistance.
 

dumdum20008

Well-Known Member
I just plot my first chart of Nifty with MS, its simple.
what interest me that 2nd Sep was 34th day ( a fibo. no) from low made on 16th july.
I may consider short with SL of HOD 2nd Sep.
 

Attachments

C

Czar

Guest
One thing of note is that since Jan, each downtrend & subsequent rally has been of almost same no. of trading days, last downtrend which ended lasted 51 days & this uptrend is now 34 sessions old so there is a possibility that 17 more sessions are left..

approx:
1st in Jan 9 down & 9 up
2nd 28 down 28 up

but we cant rely on such analysis except for historic purposes, can we ?
 

dumdum20008

Well-Known Member
One thing of note is that since Jan, each downtrend & subsequent rally has been of almost same no. of trading days, last downtrend which ended lasted 51 days & this uptrend is now 34 sessions old so there is a possibility that 17 more sessions are left..

approx:
1st in Jan 9 down & 9 up
2nd 28 down 28 up

but we cant rely on such analysis except for historic purposes, can we ?
obviously past is no projection of future. But i am pointing about possibilty of fibo turning day( 34), rather than equality of up and down legs.
 

orderflow13

Well-Known Member
obviously past is no projection of future. But i am pointing about possibilty of fibo turning day( 34), rather than equality of up and down legs.
this always made me curious, fibo on time basis,i also brought a s/w which has that facility,but i didnt hv a good exp. frnd,but this is very interesting point u mentioned,
but i used once time base fibo didnt work 4 me,might be it worked 4 u,also i tried to use indicators with fibo time periods ..like 5,8,13,21 periods,used rsi of 5 for short 13 for long ..nothin work,...might be it work 4 ya, 4 me there is no magic figure u change ur color with changing market conditions .
 

Sunil

Well-Known Member
i hope u guys seriously reconsider ur plans for shorting...
one more BIG news is out, which the financial seems to celebrate:

Bailout of Fannie & Freddie by US Govt.

Keep your eyes focussed on 4650 SPOT now.

and alex, one thing about OPTIONS: how can u be so sure that OI is due to option writing & not option buying. In Futs, we can say that if OI increases & FUT price is in discount, it means more shorts, etc.
But, how can one come to know the same about OI in options...

What i do (& this really comes handy in expiry time also):
Compare the price of both Call & Put of ATM (at the money) Option. So for example, if closing on friday was around 4350, then the closing price were:
Call 4350: 143
Put 4350: 132

The premium for calls is more than for puts; that's when I came to conclusion & discussed with czar that bias is more towards Calls side.
Ofcourse, u cant take OPTIONS as THE indicator, as options can also be used for hedging, etc...
 
C

Czar

Guest
SGX up +189 points, Dow futures shot up to +256 points, Hangseng +753

you are right Sunil, like Satda had said , should do 4650 1st... are booking on the 4700s ?
 
Last edited by a moderator:

Sunil

Well-Known Member
SatDa, my producer, will be very happy today...
movie released on friday to near-empty seats (due to Ganesh festival)

but now, it has been declared a GLOBAL HIT...
if it can take out 4650 spot, then Critics & Oscar Award too..
:))
 
Status
Not open for further replies.

Similar threads