


NIFTY FIFTY
- Thread starter AMITBE
- Start date
- Status
- Not open for further replies.
srisara said:
Amit,
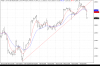
I am attaching 25 min chart of NIFTY. Nice breakup of the TrendLine. Also, most of the GAPS have been filled up.
Like to hear your comments.
Regards
Satya
I am attaching 25 min chart of NIFTY. Nice breakup of the TrendLine. Also, most of the GAPS have been filled up.
Like to hear your comments.
Regards
Satya
However, your time frame is shorter than the daily period on which I'd take my radings.
The following is from my post this morning:
AMITBE said:
In the extreme short perspective, the market is edging towards being over bought.
So some pruning down is hoped for, if this rally has to reach its potential and give direction.
The fear comes from the Mittal steel deal, and in all the brainless hysteria that is expected at open, what one doesnt want to see is a disturbance to the rhythm of the current move.
So some pruning down is hoped for, if this rally has to reach its potential and give direction.
The fear comes from the Mittal steel deal, and in all the brainless hysteria that is expected at open, what one doesnt want to see is a disturbance to the rhythm of the current move.
The late day fall was quite severe, and this magnitude was certainly not desired nor expected.
Even so, there are a few important points to note before writing off the move that has been on so far:
This is from the afternoon post:
AMITBE said:
So yet again the 2925-2937 area got tested today, the point below which this rally would be considered under threat.
What may happen tomorrow is anyone's guess...whether these levels survive or not.
What may happen tomorrow is anyone's guess...whether these levels survive or not.
Further, at 2943 tonight, the Nifty is still above the 200 DMA (2938), and 20 DMA (2901).
So these become two more reasons for not going short.
Further still, the low of Black Monday, May 22, is further below at 2896 which should be another strong support.
Sure, if and when these levels are breached, we would be looking at deeper levels, but yes, I'm still not writing off the rally...not till the chart says so.
A single day's fall cannot conclusively negate the recent move of several days, and should there be a bounce tomorrow, the equations may shift again.
That's it Satya...
Theres not a lot to add this morning and the previous post from last night is what Im
going with.
For a few important levels from my data, the line to capture is at 2961-2974-2987-3000.
Further up, consolidating above 3013 would be just great.
The downside critical levels are all mentioned in the previous post.
In the short term, to look at some levels, its absolutely important to gain control over 2952-2955.
Then above 2964 the first roadblock is 2976-2980.
Should 2988-2992 be tested, then 3000-3004-3008-3013 should lead to further gains.
On the down, 2904 is the level to hold and theres not a lot of hope below 2885-2892.certainly not till 2865.
Ahjust one more thing:
On a rather lightly positive note, the inverse H&S that has been roughly forming across most of the market never looked better as of last night!")
At 2943 last night, the right shoulder gets created.
Then, should a bounce happen, the right neckline would be tested at 3050 zone.
And any further rise from there may well cross 3100.
This is all a bit rough of course, and not a very clean and classy H&S!
And at this time it's more for entertainment that anything else!!
But hey...who knows, eh?!!
going with.
For a few important levels from my data, the line to capture is at 2961-2974-2987-3000.
Further up, consolidating above 3013 would be just great.
The downside critical levels are all mentioned in the previous post.
In the short term, to look at some levels, its absolutely important to gain control over 2952-2955.
Then above 2964 the first roadblock is 2976-2980.
Should 2988-2992 be tested, then 3000-3004-3008-3013 should lead to further gains.
On the down, 2904 is the level to hold and theres not a lot of hope below 2885-2892.certainly not till 2865.
Ahjust one more thing:
On a rather lightly positive note, the inverse H&S that has been roughly forming across most of the market never looked better as of last night!
At 2943 last night, the right shoulder gets created.
Then, should a bounce happen, the right neckline would be tested at 3050 zone.
And any further rise from there may well cross 3100.
This is all a bit rough of course, and not a very clean and classy H&S!
And at this time it's more for entertainment that anything else!!
But hey...who knows, eh?!!
AMITBE said:
Hi Satya...yes, the trendline is clearly broken on your 25 minute chart. It's certainly bearish on the very short term.
However, your time frame is shorter than the daily period on which I'd take my radings.
That's it Satya...
However, your time frame is shorter than the daily period on which I'd take my radings.
That's it Satya...
for your nice writeup. Well, when coming to turn arounds i find 25 min chart extremely useful. Especially during the intraday movement tracking it helps me a lot.
Regards
Satya
AMITBE said:
In the short term, to look at some levels, its absolutely important to gain control over 2952-2955.
Then above 2964 the first roadblock is 2976-2980.
Should 2988-2992 be tested, then 3000-3004-3008-3013 should lead to further gains.
On the down, 2904 is the level to hold and theres not a lot of hope below 2885-2892.certainly not till 2865.
Then above 2964 the first roadblock is 2976-2980.
Should 2988-2992 be tested, then 3000-3004-3008-3013 should lead to further gains.
On the down, 2904 is the level to hold and theres not a lot of hope below 2885-2892.certainly not till 2865.
To the up 2988-2992 is being tested now.
The line logicaly at this point would be 2999-3004-3009-3014-3019
.
To go up a few posts on this page, in a post addressed to Satya:
http://www.traderji.com/48922-post1603.html
2901 was suggested a strong support for yesterday, being the 20 DMA level.
The low yesterday reached down to 2899, which pretty much is that.
Today the 20 DMA mark has been adjusted to move a tad lower at 2896.
2896 is also the exact level which was tested on that Black Monday, May 22.
So, should there be hope with this major support zone, going into trade this morning.
This is the only issue Im concerned with for now, as today is likely to turn out very grave indeed.
The reason of course is the big deal thing out there in the US, and markets there as elsewhere are reeling.
But for this fact alone, on the charts (minus the poor a/d ratio), the Nifty is not at all quite so poorly placed, ruling above many important DMAs and EMAs.
However the sentiment is very low indeed.
And to go looking for an upside to all this gloom, the positive could perhaps be the fact that theres not a whole lot of negative news expected.
How severe is the Fed going to bewhether a quarter point or halfmost of all this is factored into the price action of recent times.
What comes out of Japans withdrawal of liquidity poses the greater alarm going ahead.
Pankaj is doing a great job of all this, and I have no more on these matters.
Today, the downside line is at 2956-2952-2944-2936-2928-2924-2919.
This is a critical line and how much the gap down eats into it is to be seen.
Further below I dont see a lot till the 20 DMA/Black Monday mark at 2896.
2884-2876 area begins a congestive zone further below, and another major support level posted yesterday was 2865.
Im not looking at an upside at this point, of course.
AMITBE said:
Today, the downside line is at 2956-2952-2944-2936-2928-2924-2919.
This is a critical line and how much the gap down eats into it is to be seen.
Further below I dont see a lot till the 20 DMA/Black Monday mark at 2896.
2884-2876 area begins a congestive zone further below, and another major support level posted yesterday was 2865.
Im not looking at an upside at this point, of course.
Above this line the market could turn bullish.
- Status
- Not open for further replies.
| Thread starter | Similar threads | Forum | Replies | Date |
|---|---|---|---|---|
| M | Nifty option strategy chart in Dhan Optiontrader | Brokers & Trading Platforms | 3 | |
| S | EOD data for Nifty 50 with volume | Introductions | 0 | |
| L | Nifty fifty and stock futures | Swing Trading | 13 | |
| M | Veluri Strategy intraday nifty fifty | Software | 96 | |
| T | Nifty Fifty Only + GOLD SILVER | Data Feeds | 0 |
Similar threads
-
Nifty option strategy chart in Dhan Optiontrader
- Started by MetatraderUser
- Replies: 3
-
-
-
-