Hi Dan,
I am not feeling well after seeing your chart")
I took printout and rotating it all sides to figure out what are those X and 0's...
Are those X and 0 are hugs and kisses? :lol:
Hope you are not kidding with those X/O's...If not, its really a BIG surprise
What is P&F by the way?
Get Well Soon !!!
Thanks,
...summasumma
I am not feeling well after seeing your chart
I took printout and rotating it all sides to figure out what are those X and 0's...
Are those X and 0 are hugs and kisses? :lol:
Hope you are not kidding with those X/O's...If not, its really a BIG surprise
What is P&F by the way?
Get Well Soon !!!
Thanks,
...summasumma
When someone dangles something new in front of ur eyes, your eyes should lit up and mind should go on a knowledge hunt. Google, Investigate and find out as much as u can about it. Traders learn by theory of elimination.
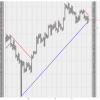
let me give u a start.... this is nifty's PnF chart...!

upload gif
Last edited: