Do we know Nifty going to bounce ?

renu daga

Well-Known Member
#71
superb dada

hats off to u
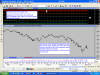
i wa sjust wondering at this moment some help by from ur dialy chart
kind enough if we go this for weekly / mnthly.... because acc to me monthly is drastic!!!
its still showing.... half way is completed..its just .5

how mnay attempts will it make to ..remain at 0?

thnks..
hope we see now last leg...

renu
 
U

uasish

Guest
#72
The attached chart is self explanatory.

The close if above the Yellow Line then an attempt for the next White Line above it can become a possibility.

2 more things to note:=
1) Both the High of 6th & 7th are almost in same Price zone.
2) The 6th's Low of 2854.05 may be a minor Pivotal Low.
 

Attachments

U

uasish

Guest
#75
In Nifty Fut EoD ,as per Elliot Wave counts we are to see a bounce.

Plz be fully aware of the relevant levels,if it happens.
So after this post of 29th Oct 9.45am,much water has passed under the bridge.

How the bottom could have been envisaged.
http://www.traderji.com/technical-a...-indicators-do-they-assist-17.html#post248428

How we thought it to be a 'zig-zag correction'
http://www.traderji.com/equities/11687-do-we-know-nifty-going-bounce-7.html#post246053

The 4th Wave is still on progress,but the velocity of the ensuing 5th down is reducing as time progresses & as envisaged this time correction was to last for few weeks & since 29th Oct 4 weeks past only.

As of now ,the levels we can expect to be resistances.
 

Attachments

#76
5299 , 4650 resistance and 2252 - 2307,1896,1292 supports on monthly charts
3241,4650,5299 resistance on weekly charts ... so we get in to an uptrend on weekly charts if 3281 ( + 40 as cushion ) is taken out . Couldnt post charts due to size restrictions.As of now the downtrend continues on weekly and monthly charts.
 
U

uasish

Guest
#79
The Chart on the above post is valid & we could see how these lines are giving Res/Supp .Moreover we where prepeared with 2817.65 & 2777.55 ,so these helped yesterday.
Yesterday's candel was an 'Engulphing Bearish' candel,the confirmation of the same is awaited today.In downtrend many a times this candel formation is seen as a Bullish signal.
Let us see.
 

devangan123

Well-Known Member
#80
The Chart on the above post is valid & we could see how these lines are giving Res/Supp .Moreover we where prepeared with 2817.65 & 2777.55 ,so these helped yesterday.
Yesterday's candel was an 'Engulphing Bearish' candel,the confirmation of the same is awaited today.In downtrend many a times this candel formation is seen as a Bullish signal.
Let us see.
dada ,

ur above post confused me a bit , can u throw some more light on above quotes , how a engulphing bearish candle can be seen a bullish signal , i was thinking that it was bearish signal which indicates start of a new fresh and deeper down trend .
 

Similar threads