Hi Ank!t007,
Observe PTC chart carefully. If you are in doubt look at the higher timeframe chart. In your case weekly chart. If you look at weekly chart you will notice that PTC had a very strong breakout around Rs. 70/- mark during 20 July 2007. Now you can expect this level to act as support, if the price were to go down to that level.
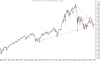
Immediate support is the level noted by you as double bottom. Though the first bottom is sligthly lower than the candle marked by you in the chart.
But look at the candles that have formed subsequently to the candle marked by you as the second bottom. What do you notice? Basically price was unable to move up inspite of repeated attempts made over several days. Observe where price closed on all these days. They closed around Rs. 87/- to Rs. 90/- So after testing a support the next upward movement is weak. Therefore it is testing the support again. Will it go up or down now? That is the important question. Action is not clear. So stay out and watch.