Trading NR7 setup

Status
Not open for further replies.

kenneth

Well-Known Member
Ken, Appreciate the chart.
If you don't mind then can u plz filter your signals to test for HV <0.5 as well.
That way, the chart will be clearer.
I think currently it is marking all NR4/NR7 days.

Happy Trading
AW10

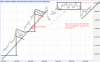
Filtered results for HV<0.5. On the chart it is indicated as NRV

Code:
Ticker	Date/Time	Buy	Close	 VolRatio	NR4day	NR7day	insideday	BuyStop	,SellStop,	
S&P CNX Nifty	11/20/2008	1	2553.150	0.36	1.00	1.00	0.00	2634.32	2502.77	
S&P CNX Nifty	12/31/2008	1	2959.150	0.49	1.00	1.00	0.00	3002.77	2937.23	
S&P CNX Nifty	1/2/2009	1	3046.750	0.33	1.00	1.00	0.00	3079.98	3021.68	
S&P CNX Nifty	2/4/2009	1	2803.050	0.43	1.00	1.00	0.00	2842.32	2780.57	
S&P CNX Nifty	2/11/2009	1	2925.700	0.40	1.00	1.00	0.00	2937.63	2877.48	
S&P CNX Nifty	2/12/2009	1	2893.050	0.46	1.00	1.00	0.00	2939.13	2886.43	
S&P CNX Nifty	3/4/2009	1	2645.200	0.44	1.00	1.00	1.00	2655.82	2611.82	
S&P CNX Nifty	3/20/2009	1	2807.050	0.27	1.00	1.00	1.00	2816.23	2773.52	
S&P CNX Nifty	3/27/2009	1	3108.650	0.46	1.00	1.00	0.00	3123.48	3055.77	
S&P CNX Nifty	6/5/2009	1	4586.900	0.25	1.00	1.00	0.00	4636.98	4561.83
Regards
Ken
 

Satyen

Well-Known Member
Rohan, If you go by the rules.. then certainly it is not NR7 day.. Rather it is WS2 (wide spread of last 2 days) day..

But if you apply the common sense, then 71 point daily range is still very tight range compared to Typical average daily range of 105 points.. i.e. we are 30% contracted then normal.I prefer to apply common sense.. rather then blindly following the rules without questioning them....

Happy Trading.

Dear AW10 How you Calculate the daily average ?? is it average price range of last 7 days ?? please give ssome ideas how to compare current range with tis average and what should we look for ?? hope you will reply
 

AW10

Well-Known Member
Yes Satya. It is that simple. Collect the range of each day. And then take moving average of it. You can use any number as per your own belief about the period. For short term, if u think 10days is good, then take use it.. for intermediate term, if u think 50 is good, then use that. These numbers are subjective.. hence I would rather leave it to you to make the choice.
I use 10 days for short term. Roughly covers half of the months hence this choice. No other reason. I could have gone for fib number of 8 or 13 but 10 also is midpoint of that fib.. so happy to use 10.

Hope this helps.
Happy Trading
 

rohangawale

Well-Known Member
:clap::rofl:What a breakout sir below 4529.
sidhaaaaaaaaaaaa 4460 wo b non stop.
it was like a superfast train. zooooooooooooooooooommmmm.

enjoyed the ride.
 

lazytrader

Well-Known Member
Technically its not NR7 day as yest range was 68 pts and todays range is 71 pts.

AW Sir can we still call it as 3NR7??
http://www.traderji.com/trading-diary/29778-daily-tryst-nifty-129.html

You are thinking in the right direction Rohan, but can't call it 3NR7.
Because strictly speaking you would need 3 days with each days range lower than the previous which didnt happen. However if there are other things you can look for like 2BNR, 3BNR (2BNR - 2 bar narrow range).

2BNR is the total range of past 2 days and 3BNR is the range for past 3. The way you calculate it is: highest high of the past 2/3 days - lowest low of past 2/3 days. Usually when a brekout happens price doesn't give you a wide range and start with narrow ranges again. It will usually run for a couple of days. Using this 2-3 day compression helps you identify it. Similarly, when prices are in a range.

You don't really need to worry about the spot future gap, it works anyway nifty is not going to sit in a range because there hasn't been a NR7 on futures. Besides there are many scrips that don't trade in futures. I use it for equities as well during entries and exits.

Credit goes to Toby Crabel.
 
Last edited:

Satyen

Well-Known Member
Dear AW10 if i want to trade 60 minitue chart with reference of NR7 ( Range contraction) Expecting there will be range expansion after break out for next 1/2 days on daily chart and this move can be caught by trading 60 minute chart ............ here we shorted then price came back to previous undecided zone so what we interepret in terms of supply demand does that indecission phase still exists in the market or efects of that NR7 gone as we had some wild move yesterday ............


Trying to understand how market moves from one phase to other ............

Waiting your valuable inputs


AW10

Well-Known Member
Satya, I share the view of LT as the price action of current week was not very clear. It was extreamly tight range.. so far current week has just shown the range of 176 pts. Last week was 202 pts range.

10 week average range is 373 pts. Even 20 week average (just to get smoother view which will discount the action of 1 big week in between) is 292 points.
So we are still in contraction (50 /60% of normal action)..

It attempted a break yesterday but I think expiry took over the action of today.
The upper range of contraction 600 is still intact. Infact mkt has seen free fall from 575 level twice. Today, though the mkt has gone up but volumn has not supported it..
so I will give it some more time to get clearer picture.. Until 4600 is not taken out with good volumn and price stays above that.. we will be on slippery ground there.

Volume is healthy, but price is not showing expansion.. That clearly indicates something to us. As per Volume spread analysis, these divergence of volumne v/s bar size is typical of reversal. It indicates that positions are changing hand (Distribution phase) and need to look out for winner from this range. (I am not expert on this.. but just recalling whatever little I read about VSA). As per my logic, Novice buy after buying has taken place.. And thats when Professionals sell.. I doubt professionals will be buyer after 700 pts move. They can very well wait for re-entry. Anyway, they still have 2 more months before they
need to release Quartly performance report, so no hurry..

Just my views.

Happy Trading.
 

lazytrader

Well-Known Member
Satya, I share the view of LT as the price action of current week was not very clear. It was extreamly tight range.. so far current week has just shown the range of 176 pts. Last week was 202 pts range.

10 week average range is 373 pts. Even 20 week average (just to get smoother view which will discount the action of 1 big week in between) is 292 points.
So we are still in contraction (50 /60% of normal action)..

It attempted a break yesterday but I think expiry took over the action of today.
The upper range of contraction 600 is still intact. Infact mkt has seen free fall from 575 level twice. Today, though the mkt has gone up but volumn has not supported it..
so I will give it some more time to get clearer picture.. Until 4600 is not taken out with good volumn and price stays above that.. we will be on slippery ground there.

Volume is healthy, but price is not showing expansion.. That clearly indicates something to us. As per Volume spread analysis, these divergence of volumne v/s bar size is typical of reversal. It indicates that positions are changing hand (Distribution phase) and need to look out for winner from this range. (I am not expert on this.. but just recalling whatever little I read about VSA). As per my logic, Novice buy after buying has taken place.. And thats when Professionals sell.. I doubt professionals will be buyer after 700 pts move. They can very well wait for re-entry. Anyway, they still have 2 more months before they
need to release Quartly performance report, so no hurry..

Just my views.

Happy Trading.
AW, yesterday we had record setting volume so I think todays low volume is justified. Will have to see wht happens tomorrow and Monday that could set the tone for Aug.

There's serious OI buildup on 4000 Put. That could have happened earlier in the month. Never bothered to check that before. What is your strategy for next month? (if you don't mind let us know :D)

BTW, I've hit 5 centuries with this one (500 Posts):gunsmilie:
 
Status
Not open for further replies.

Similar threads