Band Bollinger
Band Bollinger is powerful Technical Indicator developed by John Bollinger in 1980s. The essence of Band Bollinger is based on a moving average that defines the trend of the stock. Band Bollinger also provides relative boundaries of HIGHS & LOWS also called as "Bands" that can be used in rigorous trading approaches, pattern recognition & much more.
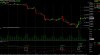
The center line is an exponential moving average; the price channels (Green & Red line) are the standard deviations of the stock being studied. The bands will expand and contract as the price action of an issue becomes volatile or becomes bound into a tight trading pattern.
Band Bollinger Calculation:
Middle band (line) = 20 days Simple moving average.
Upper Band = 20 days SMA + 20-day Standard deviation of price x 2.
Lower Band = 20 days SMA - (20-day Standard deviation of price x 2).
(Standard Deviation: Standard deviation is a mathematical formula that measures volatility)
Where to find Band Bollinger in Spider Software & how to use it?
Open new chart -> Press 'S' -> Band Bollinger (User can change the parameters too)
Things to Remember before using Band Bollinger:
1) Default Settings: Use default settings as they are back tested and works great.
2) Validate Signals: Confirm buy & sell signals with other indicators such as trendline.
3) Time Frame: Band Bollinger works great in all time frames.
4) Overbought: When stock prices touch the upper band, the prices are set to be overbought
5) Oversold: When the stock prices touch the lower band, the prices are set to be oversold.