@vsreeram77


You are merely employing fib levels on the previous day's range for intraday trade anticipation. As with everything else, there's always scope for refinement
Since you appear to have spent some effort in manual live forward testing and for formulating clearly explained rules ...... here's something which will aid you on your way for enhanced analysis and further refinement!!!
Fib Trader - Scanner
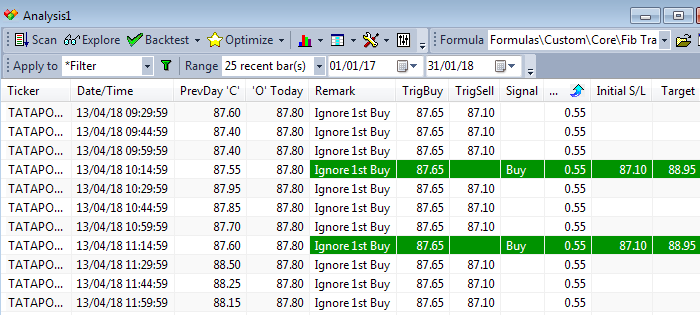
Scan example of 15M intraday timeframe on 13 Apr 18 for TATAPOWER
Apart from default columns, provides info about the previous day's close (PrevDay 'C'), the current day's open ('O' Today) and guidance ('Remark') as per their compared value(s)! As you can see it's cautioning you to ignore the first buy - the signal which triggered at 10:14:59!
The Buy rec price (TrigBuy) and Sell rec price (TrigSell) with their difference (RiskRg) is provided for anticipated trade entry order placement and calculation of optimal position sizing! The scan results for a basket of instruments are reordered automatically as per the Lowest RiskRg
Visual alert cues are provided in the form of background and foreground colours once a trade has been triggered - When this happens, the redundant rec price (the Sell rec price in this example) is removed and info about the Trade Signal, the Initial Stop Loss (Initial S/L) & the Target appears
In addition, the rule regarding comparison of rec price with the PrevDay 'C' has been internally incorporated for conditional trade signal generation
But the proof of the pudding lies in the eating - Isn't it??!!
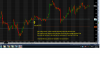
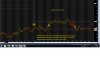
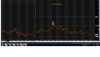
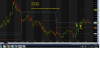
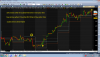
Hence - Fib Trader - Visual Chart
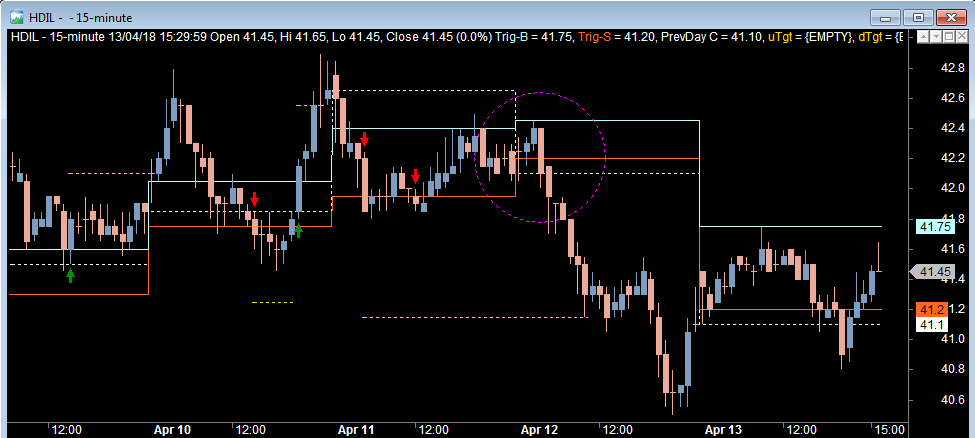
Chart example of 15M intraday timeframe on 13 Apr 18 for HDIL
The skyblue solid line is the buy rec price/ initial stop loss for sell trade (Trig-B). The orange solid line is the sell rec price/ initial stop loss for buy trade (Trig-S). The white dashed line is previous day's close (PrevDay C). AND the gold dashed lines are the trade targets (uTgt & dTgt)
The Buy/ Sell arrows are self explanatory
Once a trade triggers, the target will continue to plot until it's hit by price OR a reverse signal is triggered!!!
Note - Like I said earlier, a tool such as this will aid your analysis for further refinement! For example a nice juicy trade signal was not generated because the sell rec price (orange line) was above the previous day's close (white dashed line) - Highlighted by the dashed violet circle on 12 Apr 18 at market open!
Anyhow .... The AFL is attached. Attendant usage instructions are in the AFL itself Be sure to read them prior usage!!!
Ordinarily, a pro grade 'as per specification(s)' coding with enhanced value additions would have set you back by a couple of grand!!! ..... But this is posted Gratis
Use it Wisely & Well!!!
Cheerio!!!
You are merely employing fib levels on the previous day's range for intraday trade anticipation. As with everything else, there's always scope for refinement
Since you appear to have spent some effort in manual live forward testing and for formulating clearly explained rules ...... here's something which will aid you on your way for enhanced analysis and further refinement!!!
Fib Trader - Scanner
Scan example of 15M intraday timeframe on 13 Apr 18 for TATAPOWER
Apart from default columns, provides info about the previous day's close (PrevDay 'C'), the current day's open ('O' Today) and guidance ('Remark') as per their compared value(s)! As you can see it's cautioning you to ignore the first buy - the signal which triggered at 10:14:59!
The Buy rec price (TrigBuy) and Sell rec price (TrigSell) with their difference (RiskRg) is provided for anticipated trade entry order placement and calculation of optimal position sizing! The scan results for a basket of instruments are reordered automatically as per the Lowest RiskRg
Visual alert cues are provided in the form of background and foreground colours once a trade has been triggered - When this happens, the redundant rec price (the Sell rec price in this example) is removed and info about the Trade Signal, the Initial Stop Loss (Initial S/L) & the Target appears
In addition, the rule regarding comparison of rec price with the PrevDay 'C' has been internally incorporated for conditional trade signal generation
But the proof of the pudding lies in the eating - Isn't it??!!
Hence - Fib Trader - Visual Chart
Chart example of 15M intraday timeframe on 13 Apr 18 for HDIL
The skyblue solid line is the buy rec price/ initial stop loss for sell trade (Trig-B). The orange solid line is the sell rec price/ initial stop loss for buy trade (Trig-S). The white dashed line is previous day's close (PrevDay C). AND the gold dashed lines are the trade targets (uTgt & dTgt)
The Buy/ Sell arrows are self explanatory
Once a trade triggers, the target will continue to plot until it's hit by price OR a reverse signal is triggered!!!
Note - Like I said earlier, a tool such as this will aid your analysis for further refinement! For example a nice juicy trade signal was not generated because the sell rec price (orange line) was above the previous day's close (white dashed line) - Highlighted by the dashed violet circle on 12 Apr 18 at market open!
Anyhow .... The AFL is attached. Attendant usage instructions are in the AFL itself Be sure to read them prior usage!!!
Ordinarily, a pro grade 'as per specification(s)' coding with enhanced value additions would have set you back by a couple of grand!!! ..... But this is posted Gratis
Use it Wisely & Well!!!
Cheerio!!!