C
You can do this on a weekly basis CV instead of daily which will probably be more convenient for you. But please provide labels on your chart for easy understanding (or provide a colour coding scheme that you'll be using on your charts).
Regards,
Kalyan.
Regards,
Kalyan.
Problem with weekly updates is that as market structure changes levels change dramatically so better to update when breakouts/breakdowns happen.
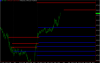
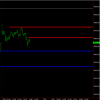
As for labels, its straightforward really, if price is above a confluence, levels turn blue otherwise red.Also being a mix of various pivots and fibs, not much numerical labelling as well.I like to keep it as straightforward and simple as possible for trading hours.
Rgds