Disclaimer : These notes/comments have been prepared solely to educate those who are interested in the useful application of Technical Analysis. While due care has been taken in preparing these notes/comments, no responsibility can be or is assumed for any consequences resulting out of acting on them.Trading in Stocks/Commodities/Futures Carry Risk.Consult your financial advisor only before you trade.
CNX NIFTY ( 6,274.25) + 107.60 + 1.74 %
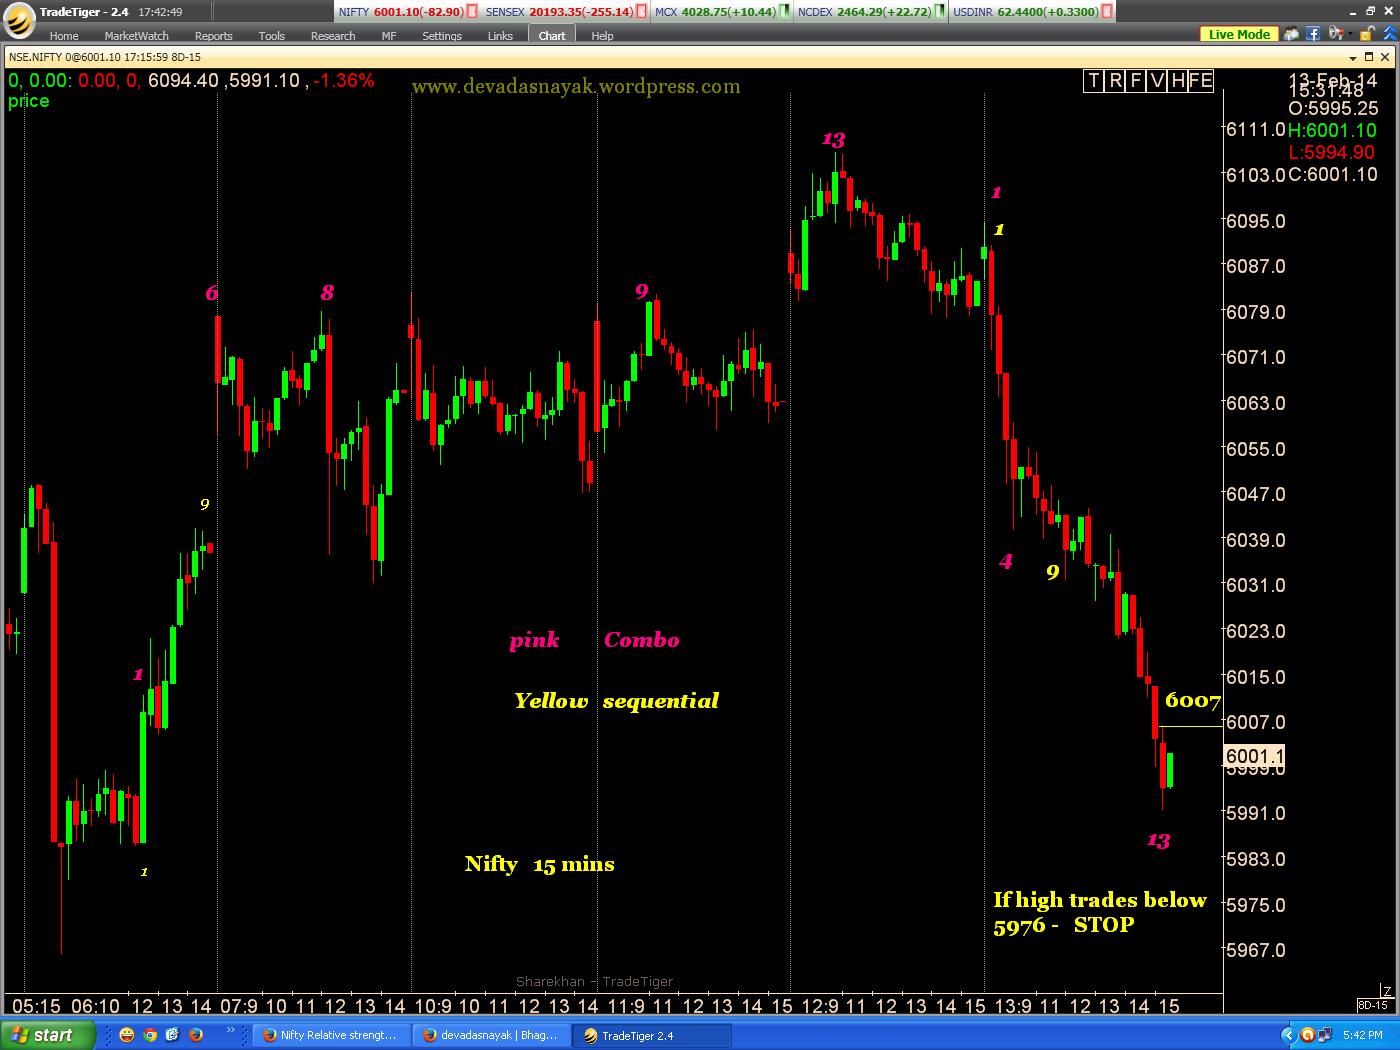
Nifty last week made a “Thrusting” candlestick pattern which is so called since it could not close above the halfway mark i.e 6292 of the black bearish engulfing Candle. .Thrusting pattern is actually a bearish pattern and selling will start once the low i.e 6129 is broken.For Nifty to be bullish it must close above 6416 on a weekly basis or should not close below 6129.

WEEKLY BANK NIFTY 11,292.35 + 204.90 +1.85 %
Weekly Bank Nifty has formed a spinning top.A spinning top at this level cannot be construed as bullish or bearish as it is a pattern of indecision.For longs stop loss is at a level of 11040 and for shorts it is at 12226 on a Weekly close basis.

TCS DAILY 2120.55
TCS has formed a bullish Saucer pattern.Stop loss is close below 1970.
CNX NIFTY ( 6,274.25) + 107.60 + 1.74 %
Nifty last week made a “Thrusting” candlestick pattern which is so called since it could not close above the halfway mark i.e 6292 of the black bearish engulfing Candle. .Thrusting pattern is actually a bearish pattern and selling will start once the low i.e 6129 is broken.For Nifty to be bullish it must close above 6416 on a weekly basis or should not close below 6129.
WEEKLY BANK NIFTY 11,292.35 + 204.90 +1.85 %
Weekly Bank Nifty has formed a spinning top.A spinning top at this level cannot be construed as bullish or bearish as it is a pattern of indecision.For longs stop loss is at a level of 11040 and for shorts it is at 12226 on a Weekly close basis.
TCS DAILY 2120.55
TCS has formed a bullish Saucer pattern.Stop loss is close below 1970.


")