


My afl collection
- Thread starter shivangi77
- Start date
- Status
- Not open for further replies.


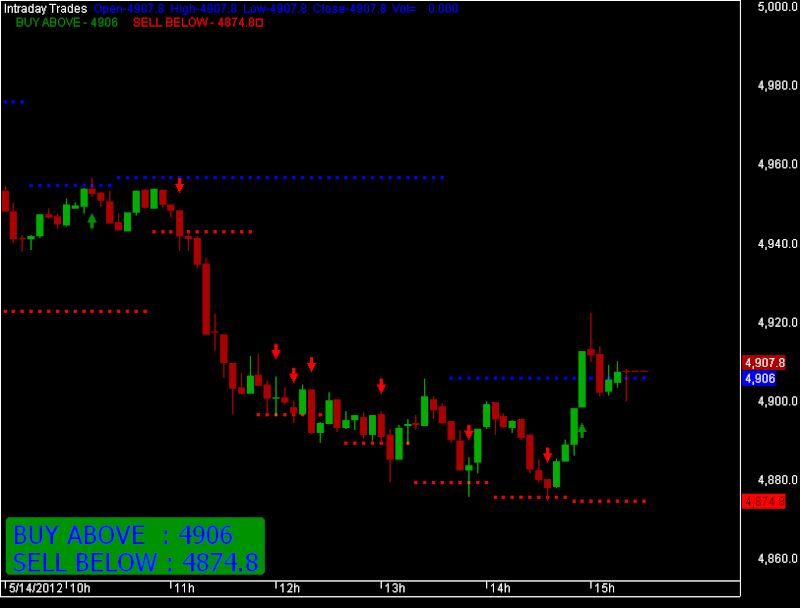
Buy Sell Afl
Code:
Version(5.20);

xx=BarIndex();x=xx;Lx=LastValue(x);

nbar=Param("N Pivot Bars",3,2,50,1);

npiv=Param("N Pivots lookback period",1,1,50,1);

PivotSymmetry=ParamToggle("Use Symmetric Pivots","Off|On",0);

CleanPivots=ParamToggle("Use Clean Pivots","Off|On",0);

srStyle=ParamToggle("S/R Style","Off|On",1);


if (PivotSymmetry)

{

  fc=1;
    pk=H>Ref(HHV(H,nbar*fc),-1) AND Ref(HHV(H,nbar),nbar)<=H;
    pk=pk AND Lx-ValueWhen(pk,x)>nbar*fc;
    tr=L<Ref(LLV(L,nbar*fc),-1) AND Ref(LLV(L,nbar),nbar)>=L;
    tr=tr AND Lx-ValueWhen(tr,x)>nbar*fc;
}
else
{
    fc=2;
    pk=H>Ref(HHV(H,nbar*fc),-1) AND Ref(HHV(H,nbar),nbar)<=H;
    pk=pk AND Lx-ValueWhen(pk,x)>nbar*fc;
    tr=L<Ref(LLV(L,nbar*fc),-1) AND Ref(LLV(L,nbar),nbar)>=L;
    tr=tr AND Lx-ValueWhen(tr,x)>nbar*fc;

}

px0=ValueWhen(pk,x,0); tx0=ValueWhen(tr,x,0);

px1=ValueWhen(pk,x,1); tx1=ValueWhen(tr,x,1);

px2=ValueWhen(pk,x,2); tx2=ValueWhen(tr,x,2);

px3=ValueWhen(pk,x,3); tx3=ValueWhen(tr,x,3);

ph0=ValueWhen(pk,H,0); tl0=ValueWhen(tr,L,0);

ph1=ValueWhen(pk,H,1); tl1=ValueWhen(tr,L,1);

ph2=ValueWhen(pk,H,2); tl2=ValueWhen(tr,L,2);

ph3=ValueWhen(pk,H,3); tl3=ValueWhen(tr,L,3);

if (CleanPivots)

{

  pk=IIf(pk AND px0<tx0 AND ph0>ph1,False,pk);

  tr=IIf(tr AND px0>tx0 AND tl0<tl1,False,tr);

  pk=IIf(pk AND px2>tx1 AND ph1<=ph2,False,pk);

  tr=IIf(tr AND tx2>px1 AND tl1>=tl2,False,tr);

 px0=ValueWhen(pk,x,0); tx0=ValueWhen(tr,x,0);
    px1=ValueWhen(pk,x,1); tx1=ValueWhen(tr,x,1);
    px2=ValueWhen(pk,x,2); tx2=ValueWhen(tr,x,2);
    px3=ValueWhen(pk,x,3); tx3=ValueWhen(tr,x,3);
    ph0=ValueWhen(pk,H,0); tl0=ValueWhen(tr,L,0);
    ph1=ValueWhen(pk,H,1); tl1=ValueWhen(tr,L,1);
    ph2=ValueWhen(pk,H,2); tl2=ValueWhen(tr,L,2);
    ph3=ValueWhen(pk,H,3); tl3=ValueWhen(tr,L,3);
}


GraphXSpace=20;

SetChartOptions(0,chartShowDates);

SetBarFillColor(IIf(C>O,ColorRGB(0,175,0),IIf(C<=O,ColorRGB(175,0,0),colorLightGrey)));

Plot(C,"\nPrice",IIf(C>O,ColorRGB(0,175,0),IIf(C<=O,ColorRGB(175,0,0),colorLightGrey)),64,0,0,0);
//plotting  circles
//PlotShapes(shapeSmallCircle*tr,IIf(Lx-ValueWhen(tr,x)>nbar,ColorRGB(0,100,0),colorWhite),0,L,-10);

//PlotShapes(shapeSmallCircle*pk,IIf(Lx-ValueWhen(pk,x)>nbar,ColorRGB(255,0,0),colorWhite),0,H,10);


if(srstyle)

{

miny=Status("axisminy");

maxy=Status("axismaxy");

for (i=1;i<=npiv;i++)

{

    rr=Ref(ValueWhen(pk,H,i),-nbar);

    rr=IIf(rr>maxy OR rr<miny,Null,rr);

    ss=Ref(ValueWhen(tr,L,i),-nbar);

    ss=IIf(ss>maxy OR ss<miny,Null,ss);

    Plot(rr,"",colorBlue,styleNoLine|styleDots,0,0,0);

    Plot(ss,"",colorRed,styleNoLine|styleDots,0,0,0);
Buy = Cross(H,rr);
Sell= Cross(ss,L);
PlotShapes(IIf(Buy, shapeUpArrow, shapeNone),colorGreen, 0,L, Offset=-25);
PlotShapes(IIf(Sell, shapeDownArrow, shapeNone),colorRed, 0,H, Offset=-25);

}

}

else

{

  rr=ValueWhen(pk,H);

  rr1=IIf(rr AND BarsSince(pk)>nbar,rr,Null);

  rr2=IIf(rr AND BarsSince(pk)<=nbar,rr,Null);

  ss=ValueWhen(tr,L);

  ss1=IIf(ss AND BarsSince(tr)>nbar,ss,Null);

  ss2=IIf(ss AND BarsSince(tr)<=nbar,ss,Null);

  Plot(rr1,"",colorRed,1);

  Plot(rr2,"",colorLightGrey,styleDots|styleNoLine);

  Plot(ss1,"",colorGreen,1);

  Plot(ss2,"",colorLightGrey,styleDots | styleNoLine);

}


Title = EncodeColor(colorWhite)+ "Intraday Trades" + EncodeColor(colorBlue) +"  Open-"+O+"  "+"High-"+H+"  "+"Low-"+L+"  "+
"Close-"+C+"  "+ "Vol= "+ WriteVal(V)+"\n"+EncodeColor(colorGreen)+"    BUY ABOVE - "+RR+" "+EncodeColor(colorRed)+
"    SELL BELOW - "+SS+"   ";

_SECTION_END();
GfxSetBkMode( 1 );
GfxSetTextColor( colorBlue );
GfxSelectSolidBrush(colorGreen); // this is the box background color

GfxSelectFont( "Tahoma", 20, 100 );
pxHeight = Status( "pxchartheight" ) ;
 xx = Status( "pxchartwidth");
Left = 1100;
width = 280;
x = 5;
x2 = 270;

y = pxHeight;

//GfxSelectPen( colorGreen, 1); // broader color
GfxRoundRect( x, y - 60, x2, y , 7, 7 ) ;
//GfxTextOut( ( " Trading System "),88,y-165);
GfxTextOut( (" "),27,y-160);
GfxTextOut( ("BUY ABOVE  : "+RR+" "), 13, y-58) ; // The text format location
GfxTextOut( ("SELL BELOW : "+SS+""), 13, y-30);Fibonacci Trend Break System
Code:
/**
*
Author : Nishant Kulkarni
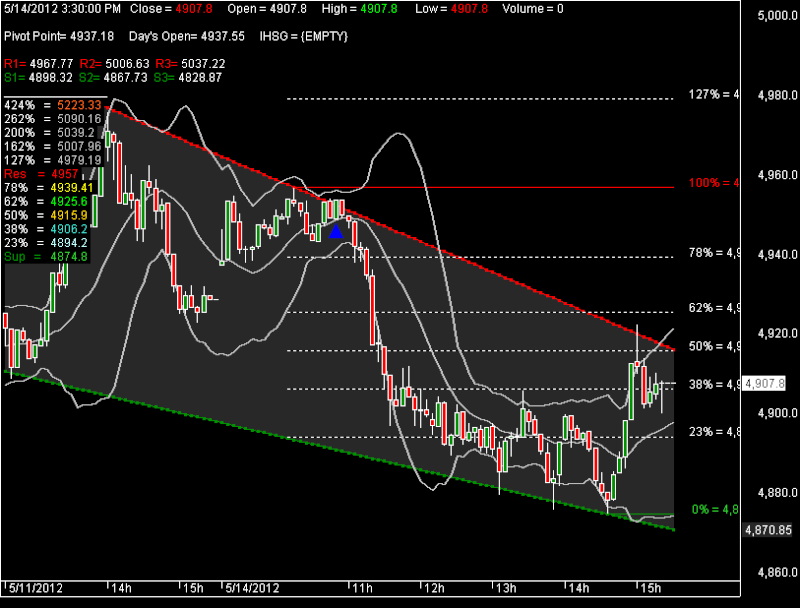
Intraday Fibonacii Trend Break System. This system is based on the double bottom and double top detection technique and fibonacii internal external by David K.
A line joining two tops when connected together and another line joining bottom line is connected together and when both line extended forms a funnel and
a break outside gives very strong break out.
It is recomended to have Heikin Ashi plot bellow main price plot as confirmation. Big heikin ashi candles confirm price movement.
Note: Use 1 Hour interval for more stable results.
Disclaimer Trade with caution. Author does not take any responsibility. The system is to guide traders and does not
guaranty any performance. The system is used in Indian market condition. For other markets, may need to be altered slightly. However I am personally using this system and booking profit, hence contributing
this formula for community as give back.
The system also makes use of Fibonacci Internal and External Retracements formula by David K.
http://www.amibroker.com/library/detail.php?id=1084
*/
_SECTION_BEGIN("INIT");
SetChartOptions(0,chartShowArrows|chartShowDates);
fraction= IIf(StrRight(Name(),3) == "", 3.2, 3.2);
tchoice=Param("Title Selection ",2,1,2,1);
PlotCandle = ParamToggle("Plot IHSG Candle", "No,Yes", 0);
_SECTION_END();
_SECTION_BEGIN("Price");
_N(Title = StrFormat("{{NAME}} - {{INTERVAL}} {{DATE}} Open %g, Hi %g, Lo %g, Close %g (%.1f%%) Vol " +WriteVal( V, 1.0 ) +" {{VALUES}}", O, H, L, C, SelectedValue( ROC( C, 1 )) ));
Plot( C, _DEFAULT_NAME(), colorWhite , styleNoTitle | ParamStyle("Style") | GetPriceStyle() );
_SECTION_END();
_SECTION_BEGIN("Index_Compare");
IndexName = ParamList("IndexName ","COMPOSITE|^NSEBANK|^CNXIT|",0);
PlotForeign(IndexName,_DEFAULT_NAME(),colorBlue , styleNoTitle | styleOwnScale | styleLine | styleThick );
_SECTION_END();
_SECTION_BEGIN("BBands");
P = ParamField("Price field",-1);
Periods = Param("Periods", 15, 2, 100, 1 );
Width = Param("Width", 2, 0, 10, 0.05 );
Color = ParamColor("Color", colorLightGrey );
Style = ParamStyle("Style", styleNoRescale | styleNoTitle | styleNoLabel | styleThick);
BBTop = BBandTop( P, Periods, Width );
BBBot = BBandBot( P, Periods, Width );
BBMiddle = BBBot + ((BBTop-BBBot)/2);
Plot(BBTop , "BBTop" + _PARAM_VALUES(), Color, Style );
Plot(BBBot, "BBBot" + _PARAM_VALUES(), Color, Style );
Plot(BBMiddle , "BBMiddle" + _PARAM_VALUES(), Color, Style );
_SECTION_END();
_SECTION_BEGIN("Fib Retracements");
fibs = ParamToggle("Plot Fibs","Off|On",1);
pctH = Param ("Pivot Hi %", 0.325,0.001,2.0,0.002);
HiLB = Param ("Hi LookBack",1,1,BarCount-1,1);
pctL = Param ("Pivot Lo %", 0.325,0.001,2.0,0.002);
LoLB = Param ("Lo LookBack",1,1,BarCount-1,1);
Back = Param ("Extend Left = 2",1,1,500,1);
Fwd = Param("Plot Forward", 0, 0, 500, 1);
text = ParamToggle("Plot Text","Off|On",1);
hts = Param ("Text Shift", -33.5,-50,50,0.10);
style =ParamStyle("Line Style",styleLine,styleNoLabel);
x = BarIndex();
pRp = PeakBars( H, pctH, 1) == 0;
yRp0 = LastValue(ValueWhen( pRp, H, HiLB));
xRp0 = LastValue(ValueWhen( pRp, x, HiLB));
pSp = TroughBars( L, pctL, 1) == 0;
ySp0 = LastValue(ValueWhen( pSp, L, LoLB));
xSp0 = LastValue(ValueWhen( pSp, x, LoLB));
Delta = yRp0 - ySp0;
function fib(ret) {
retval = (Delta * ret);
Fibval = IIf(ret < 1.0
AND xSp0 < xRp0, yRp0 - retval, IIf(ret < 1.0
AND xSp0 > xRp0, ySp0 + retval,IIf(ret > 1.0
AND xSp0 < xRp0, yRp0 - retval, IIf(ret > 1.0
AND xSp0 > xRp0, ySp0 + retval, Null))));
return FibVal;
}
x0 = Min(xSp0,xRp0)-Back;
x1 = (BarCount -1);
//////////////////////////////////////////////////////////////////
r236 = fib(0.236); r236I = LastValue (r236,1);
r382 = fib(0.382); r382I = LastValue (r382,1);
r050 = fib(0.50); r050I = LastValue (r050,1);
r618 = fib(0.618); r618I = LastValue (r618,1);
r786 = fib(0.786); r786I = LastValue (r786,1);
e127 = fib(1.27); e127I = LastValue (e127,1);
e162 = fib(1.62); e162I = LastValue (e162,1);
e200 = fib(2.00); e200I = LastValue (e200,1);
e262 = fib(2.62); e262I = LastValue (e262,1);
e424 = fib(4.24); e424I = LastValue (e424,1);
//////////////////////////////////////////////////////////////////
p00 = IIf(xSp0 > xRp0,ySp0,yRp0); p00I = LastValue (p00,1);
p100 = IIf(xSp0 < xRp0,ySp0,yRp0); p100I = LastValue (p100,1);
color00 =IIf(xSp0 > xRp0,colorLime,colorRed);
color100 =IIf(xSp0 < xRp0,colorLime,colorRed);
//////////////////////////////////////////////////////////////////
numbars = LastValue(Cum(Status("barvisible")));
fraction= IIf(StrRight(Name(),3) == "", 3.2, 3.2);
//////////////////////////////////////////////////////////////////
if(fibs==1) {
Plot(LineArray(xRp0-Fwd,yRp0,x1,yRp0,Back),"PR",32,styleThick | styleNoRescale | styleNoLabel | styleNoTitle,Null, Null,Fwd);
Plot(LineArray(xSp0-Fwd,ySp0,x1,ySp0,Back),"PS",27, styleThick | styleNoRescale | styleNoLabel | styleNoTitle,Null, Null,Fwd);
Plot(LineArray(x0-Fwd,r236,x1,r236,Back),"",colorWhite,style|styleNoRescale | styleNoLabel | styleDashed,Null, Null,Fwd);
Plot(LineArray(x0-Fwd,r382,x1,r382,Back),"",colorWhite,style|styleNoRescale | styleNoLabel | styleDashed,Null, Null,Fwd);
Plot(LineArray(x0-Fwd,r050,x1,r050,Back),"",colorWhite,style|styleNoRescale | styleNoLabel | styleDashed,Null, Null,Fwd);
Plot(LineArray(x0-Fwd,r618,x1,r618,Back),"",colorWhite,style|styleNoRescale | styleNoLabel | styleDashed,Null, Null,Fwd);
Plot(LineArray(x0-Fwd,r786,x1,r786,Back),"",colorWhite,style|styleNoRescale | styleNoLabel | styleDashed,Null, Null,Fwd);
Plot(LineArray(x0-Fwd,e127,x1,e127,Back),"e127",colorWhite,style|styleNoRescale | styleNoLabel | styleDashed,Null, Null,Fwd);
Plot(LineArray(x0-Fwd,e162,x1,e162,Back),"e162",colorWhite,style|styleNoRescale | styleNoLabel | styleDashed,Null, Null,Fwd);
Plot(LineArray(x0-Fwd,e200,x1,e200,Back),"p200",colorWhite,style|styleNoRescale | styleNoLabel | styleDashed,Null, Null,Fwd);
Plot(LineArray(x0-Fwd,e262,x1,e262,Back),"p262",colorWhite,style|styleNoRescale | styleNoLabel | styleDashed,Null, Null,Fwd);
Plot(LineArray(x0-Fwd,e424,x1,e424,Back),"p424",colorWhite,style|styleNoRescale | styleNoLabel | styleDashed,Null, Null,Fwd);
}
//////////////////////////////////////////////////////////////////
if(text==1) {
PlotText(" 0% = " + WriteVal(p00,fraction), LastValue(BarIndex())-(numbars/hts), p00I + 0.05, color00);
PlotText("23% = " + WriteVal(r236,fraction), LastValue(BarIndex())-(numbars/hts), r236I + 0.05, colorWhite);
PlotText("38% = " + WriteVal(r382,fraction), LastValue(BarIndex())-(numbars/hts), r382I + 0.05, colorWhite);
PlotText("50% = " + WriteVal(r050,fraction), LastValue(BarIndex())-(numbars/hts), r050I + 0.05, colorWhite);
PlotText("62% = " + WriteVal(r618,fraction), LastValue(BarIndex())-(numbars/hts), r618I + 0.05, colorWhite);
PlotText("78% = " + WriteVal(r786,fraction), LastValue(BarIndex())-(numbars/hts), r786I + 0.05, colorWhite);
PlotText("100% = " + WriteVal(p100,fraction), LastValue(BarIndex())-(numbars/hts),p100I + 0.05, color100);
PlotText("127% = " + WriteVal(e127,fraction), LastValue(BarIndex())-(numbars/hts),e127I + 0.05, colorWhite);
PlotText("162% = " + WriteVal(e162,fraction), LastValue(BarIndex())-(numbars/hts),e162I + 0.05, colorWhite);
PlotText("200% = " + WriteVal(e200,fraction), LastValue(BarIndex())-(numbars/hts),e200I + 0.05, colorWhite);
PlotText("262% = " + WriteVal(e262,fraction), LastValue(BarIndex())-(numbars/hts),e262I + 0.05, colorWhite);
PlotText("424% = " + WriteVal(e424,fraction), LastValue(BarIndex())-(numbars/hts),e424I + 0.05, colorWhite);
}
_SECTION_END();
_SECTION_BEGIN("Pivot");
YH = TimeFrameGetPrice("H", inDaily, -1); // yesterdays high
YL = TimeFrameGetPrice("L", inDaily, -1); // low
YC = TimeFrameGetPrice("C", inDaily, -1); // close
YO = TimeFrameGetPrice("O", inDaily); // current day open
//Normal Pivot
PP = (YH + YL + YC) / 3;
R1 = (2 * PP) - YL;
R2 = PP + (YH - YL);
R3 = YH + 2*(PP-YL);
S1 = (2 * PP) - YH;
S2 = PP - (YH - YL);
S3 = YL - 2*(YH - PP) ;
_SECTION_END();
_SECTION_BEGIN("TITLE");
//////////////////////////////////////////////////////////////////
if (tchoice==1 ) {
_N(Title = EncodeColor(colorWhite)+StrFormat(" {{NAME}} - {{INTERVAL}} {{DATE}} Open: %g, High: %g, Low: %g, Close: %g {{VALUES}}",O, H, L, C, SelectedValue( ROC( C, 1 ) ) ));
}
//////////////////////////////////////////////////////////////////WriteVal(HC ,fraction)
if (tchoice==2 ) {
Title = EncodeColor(colorWhite)+ Date() + " Close = " + EncodeColor(colorRed) +Close +
EncodeColor(colorWhite) + " Open = " + EncodeColor(colorWhite) + O +
EncodeColor(colorWhite) + " High = " + EncodeColor(5) + H +
EncodeColor(colorWhite) + " Low = " + EncodeColor(colorRed) + L +
EncodeColor(colorWhite) + " Volume = " + EncodeColor(colorWhite) + V + "\n\n"+
EncodeColor(colorWhite) + "Pivot Point= " + EncodeColor(colorWhite) + PP +
EncodeColor(colorWhite) + " Day's Open= " + EncodeColor(colorWhite) + YO +
EncodeColor(colorWhite) + " IHSG = " + EncodeColor(colorWhite) + Foreign("COMPOSITE","C") +"\n\n"+
EncodeColor(colorRed) + "R1= " + EncodeColor(colorWhite) + R1 +
EncodeColor(colorRed) + " R2= " + EncodeColor(colorWhite) + R2 +
EncodeColor(colorRed) + " R3= " + EncodeColor(colorWhite) + R3 +"\n"+
EncodeColor(colorGreen) + "S1= " + EncodeColor(colorWhite) + S1 +
EncodeColor(colorGreen) + " S2= " + EncodeColor(colorWhite) + S2 +
EncodeColor(colorGreen) + " S3= " + EncodeColor(colorWhite) + S3 +"\n"+
EncodeColor( colorWhite) +"_______________"+"\n"+
EncodeColor( colorWhite) + "424% = " + EncodeColor(25)+ e424 + " " +"\n"+
EncodeColor( colorWhite) + "262% = " + EncodeColor(47)+ e262 + " " +"\n"+
EncodeColor( colorWhite) + "200% = " + EncodeColor(47)+ e200 + " " +"\n"+
EncodeColor( colorWhite) + "162% = " + EncodeColor(47)+ e162 + " " +"\n"+
EncodeColor( colorWhite) + "127% = " + EncodeColor(47)+ e127 + " " +"\n"+
EncodeColor( colorRed) + "Res = " + EncodeColor(32)+ p100 + " "+"\n"+
EncodeColor( colorWhite) + "78% = " + EncodeColor(42)+ r786 + " " +"\n"+
EncodeColor( colorWhite) + "62% = " + EncodeColor(43)+ r618 + " "+"\n"+
EncodeColor( colorWhite) + "50% = " + EncodeColor(41)+ r050 + " "+"\n"+
EncodeColor( colorWhite) + "38% = " + EncodeColor(44)+ r382 + " "+"\n"+
EncodeColor( colorWhite) + "23% = " + EncodeColor(45)+ r236+ " " +"\n"+
EncodeColor( colorGreen) + "Sup = " + EncodeColor(34)+ p00 + " " ;
}
_SECTION_END();
_SECTION_BEGIN("Up Trend Line");
UTValue1=LastValue(Trough(L,1,2));
UTValue2=ySp0;
UTBar1=BarCount - 1 - LastValue(TroughBars(L,1,2));
price_utbar1=Close[UTBar1];
UTBar2=xSp0;
price_utbar2=Close[UTBar2];
UpTrendLine = LineArray( UTBar1, UTValue1, UTBar2,UTValue2, 1 );
UTLine = LineArray( UTBar1, UTValue1, UTBar2,UTValue2, 0 );
Plot( UpTrendLine , _DEFAULT_NAME(), colorGreen,styleDots | styleNoTitle | styleNoLabel);
Plot( UTLine , _DEFAULT_NAME(), colorGreen,styleDots | styleNoTitle | styleNoLabel);
_SECTION_END();
_SECTION_BEGIN("Down Trend Line");
DTValue1=LastValue(Peak(H,1,2));
DTValue2=yRp0;
DTBar1=BarCount - 1 - LastValue(PeakBars(H,1,2));
price_dtbar1=Close[DTBar1];
DTBar2=xRp0;
price_dtbar2=Close[DTBar2];
DownTrendLine = LineArray( DTBar1, DTValue1, DTBar2,DTValue2, 1 );
DTLine = LineArray( DTBar1, DTValue1, DTBar2,DTValue2, 0 );
Plot( DownTrendLine ,_DEFAULT_NAME(), colorRed,styleDots | styleNoTitle | styleNoLabel);
Plot( DTLine ,_DEFAULT_NAME(), colorRed,styleDots | styleNoTitle | styleNoLabel);
PlotOHLC( DownTrendLine , DownTrendLine , UpTrendLine , UpTrendLine , "", colorDarkGrey, styleCloud | styleNoRescale);
DTLine = LineArray(xRp0-Fwd,yRp0,x1,yRp0,Back);
UTLine = LineArray(xSp0-Fwd,ySp0,x1,ySp0,Back);
CBuy = Cross(C,DownTrendLine );
CSell = Cross(UpTrendLine ,C);
baratcbuy = LastValue(ValueWhen(CBuy,BarIndex()));
baratcsell = LastValue(ValueWhen(CSell,BarIndex()));
CBuy = CBuy AND BarIndex() == baratcbuy ;
CSell = CSell AND BarIndex() == baratcsell ;
PlotShapes(shapeUpTriangle* CBuy ,colorBlue,O,L);
PlotShapes(shapeDownTriangle* CSell ,colorRed,O,H);
CBuy1 = Cross(C,DTLine );
CSell1 = Cross(UTLine ,C);
baratcbuy1 = LastValue(ValueWhen(CBuy1,BarIndex()));
baratcsell1 = LastValue(ValueWhen(CSell1,BarIndex()));
CBuy1 = CBuy1 AND BarIndex() == baratcbuy1 ;
CSell1 = CSell1 AND BarIndex() == baratcsell1 ;
PlotShapes(shapeHollowUpTriangle* CBuy1 ,colorBlue,O,L-1);
PlotShapes(shapeHollowDownTriangle* CSell1 ,colorRed,O,H-1);
_SECTION_END();
_SECTION_BEGIN("Auto");
ScanLookBack = Param("Scan Lookback", 1, 1, 25 );
Buy = ( CBuy OR CBuy1) AND ( (BarCount - baratcBuy )<=ScanLookBack OR (BarCount - baratcbuy1 )<=ScanLookBack);
Sell = ( CSell OR CSell1) AND ( (BarCount - baratcsell )<=ScanLookBack OR (BarCount - baratcsell1 )<=ScanLookBack ) ;
price = C[BarCount-1];
AlertIf(Buy,"","Buy @"+C+" Price @ Trigger="+price,1);
AlertIf(Sell,"","Sell @"+C+" Price @ Trigger="+price,2);
Filter = Buy OR Sell ;
Var = WriteIf(Buy,"BUY",WriteIf(Sell,"SELL",""));
AddTextColumn( Var , "Buy/Sell", 1.2 , colorWhite, IIf( Buy, colorLime, IIf(Sell,colorOrange,colorWhite) ));
AddColumn(price ,"Price",1.2,colorWhite, IIf( Buy, colorLime, IIf(Sell,colorOrange,colorWhite) ));
AddColumn(C ,"Price @ Trigger",1.2,colorWhite, IIf( Buy, colorLime, IIf(Sell,colorOrange,colorWhite) ));
stoploss = IIf(Buy, (price * (1-0.01)) , IIf(Sell, (price * (1+0.01)),0));
target1per = IIf(Buy, (price * (1+0.01)) , IIf(Sell, (price * (1-0.01)),0));
target15per = IIf(Buy, (price * (1+0.015)) , IIf(Sell, (price * (1-0.015)),0));
target2per = IIf(Buy, (price * (1+0.02)) , IIf(Sell, (price * (1-0.02)),0));
AddColumn(stoploss ,"Stop Loss",1.2,colorWhite, IIf( Buy, colorLime, IIf(Sell,colorOrange,colorWhite) ));
AddColumn(target1per ,"1% Target",1.2,colorBlack, IIf( Buy, colorLime, IIf(Sell,colorOrange,colorWhite) ));
AddColumn(target15per ,"1.5% Target",1.2,colorBlack, IIf( Buy, colorLime, IIf(Sell,colorOrange,colorWhite) ));
AddColumn(target2per ,"2% Target",1.2,colorBlack, IIf( Buy, colorLime, IIf(Sell,colorOrange,colorWhite) ));
AddColumn(V ,"Volume",1.2,colorBlack, IIf( Buy, colorLime, IIf(Sell,colorOrange,colorWhite) ));
_SECTION_END();
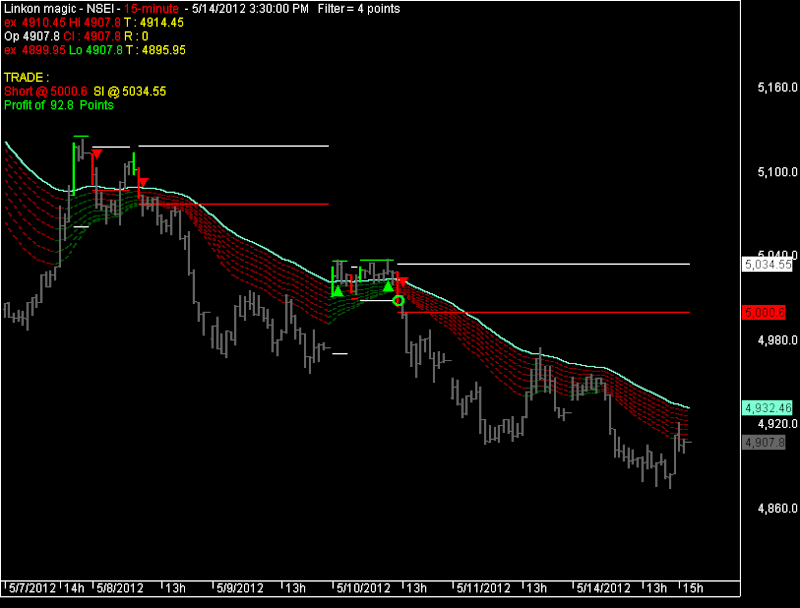
GraphXSpace = 10 ;Linkon Magic Afl
Code:
/////SH Intraday Statregy - ELH5/////////////////
_SECTION_BEGIN("Price");

Filt = 4;//Optimize("filter",5,0,10,1);
p = 39;//Optimize("period",35,5,40,1);

ad  = ADX(p);
pd = PDI(p);
md = MDI(p);

Col_bar =
IIf(Cross(pd,md),colorBrightGreen,
IIf(Cross(md,pd),colorRed,
colorGrey40));

Plot( C, "Close", col_bar, styleBar+styleThick );

Buy_trigger = ValueWhen(Cross(pd,md),HHV(H,2),1)+filt;
Buy_sl = ValueWhen(Cross(pd,md),LLV(L,2),1)-filt;

Short_trigger = ValueWhen(Cross(md,pd),LLV(L,2),1)-filt;
Short_sl = ValueWhen(Cross(md,pd),HHV(H,2),1)+filt;

Buy = Cross(H,Buy_trigger) AND pd > md ;
BuyPrice = ValueWhen(Buy,Buy_trigger,1);

Sell = Cross(Buy_sl,L);
SellPrice=ValueWhen(Sell,Buy_sl,1);

Short = Cross(Short_trigger,L) AND md > pd ;
ShortPrice = ValueWhen(Short,Short_trigger,1);

Cover = Cross(H,Short_sl);
CoverPrice = ValueWhen(Cover,Short_sl,1);

PlotShapes(Buy*shapeSmallUpTriangle,colorBrightGreen,0,L,-15);
PlotShapes(Short*shapeSmallDownTriangle,colorRed,0,H,-15);

Long=Flip(Buy,Short);
Shrt=Flip(Short,Buy );

PlotShapes(Sell*IIf(long,shapeHollowCircle,shapeNone),colorBrightGreen,0,Buy_sl,0);
PlotShapes(Cover*IIf(shrt,shapeHollowCircle,shapeNone),colorRed,0,short_sl,0);
//PlotShapes(Cover*shapeHollowCircle,colorRed,0,short_sl,0);

md_cross_pd = Cross(md,pd);
pd_cross_md = Cross(pd,md);

//PlotShapes(pd_cross_md*shapeUpTriangle,colorBrightGreen,0,H,-8);
//PlotShapes(pd_cross_md*shapeUpTriangle,colorWhite,0,L,8);
//PlotShapes(pd_cross_md*shapeSmallUpTriangle,colorYellow,0,L,16);
//PlotShapes(pd_cross_md*shapeSmallUpTriangle,colorGreen,0,L,24);

//PlotShapes(md_cross_pd*shapeDownTriangle,colorRed,0,L,-8);
//PlotShapes(md_cross_pd*shapeDownTriangle,colorWhite,0,H,8);
//PlotShapes(md_cross_pd*shapeSmallDownTriangle,colorYellow,0,H,16);
//PlotShapes(md_cross_pd*shapeSmallDownTriangle,colorOrange,0,H,24);

Plot(IIf(pd > md,Buy_sl,Null),"",colorWhite,styleThick);
Plot(IIf(pd > md ,Buy_trigger,Null),"",colorBrightGreen,styleThick);
Plot(IIf(md > pd ,Short_sl,Null),"",colorWhite,styleThick);
Plot(IIf(md > pd, short_trigger,Null),"",colorRed,styleThick);

Title =
EncodeColor(colorWhite)+ "Linkon magic" + " - " +  Name() + " - " +  EncodeColor(colorRed)+ Interval(2)+ EncodeColor(colorWhite) +
 "  - " + Date() +
 "  Filter = "+ filt + " points"+

"\n"+
WriteIf(Ref(H,-1) > Ref(H,-2),EncodeColor(colorBrightGreen),EncodeColor(colorRed))+"ex  "+Ref(H,-1)+WriteIf(H > Ref(H,-1),EncodeColor(colorBrightGreen),EncodeColor(colorRed))+" Hi "+H+
EncodeColor(colorYellow)+ " T : "+WriteIf(H > (Ref(H,-1)+filt),EncodeColor(colorBrightGreen),EncodeColor(colorYellow))+(Ref(H,-1)+filt)+
"\n"+
EncodeColor(colorWhite)+"Op "+O+WriteIf(C > O, EncodeColor(colorBrightGreen),EncodeColor(colorRed))+" Cl : " +C+
EncodeColor(colorYellow)+" R : "+round(1000*(H-L))/1000+

"\n"+
WriteIf(Ref(L,-1) < Ref(L,-2),EncodeColor(colorRed),EncodeColor(colorBrightGreen))+"ex  "+Ref(L,-1)+WriteIf(L < Ref(L,-1),EncodeColor(colorRed),EncodeColor(colorBrightGreen))+" Lo "+L+
EncodeColor(colorYellow)+ " T : "+WriteIf(L < (Ref(L,-1)-filt), EncodeColor(colorRed),EncodeColor(colorYellow))+(Ref(L,-1)-Filt)+

"\n"+"\n"+
EncodeColor(colorYellow)+"TRADE : "+
WriteIf(Long,EncodeColor(colorBrightGreen)+"\nLong @ "+Buy_trigger+EncodeColor(colorYellow)+"  Sl @ "+Buy_sl+
WriteIf(round((C - Buy_trigger)*10)/10 > 0,EncodeColor(colorBrightGreen)+"\nProfit of  ",EncodeColor(colorRed)+"\nLoss of  ")+
round((C - Buy_trigger)*10)/10+ "  Points","")+

WriteIf(Shrt,EncodeColor(colorRed)+"\nShort @ "+short_trigger+EncodeColor(colorYellow)+"  Sl @ "+short_sl+
WriteIf(round((short_trigger-C)*10)/10 > 0,EncodeColor(colorBrightGreen)+"\nProfit of  ",EncodeColor(colorRed)+"\nLoss of  ")+
round((short_trigger-C)*10)/10+ "  Points","")+
WriteIf(Shrt AND pd > md,EncodeColor(colorBrightGreen)+"\nWARNING : place Buy trigger @ "+ Buy_trigger,"")+
WriteIf(Long AND md > pd,EncodeColor(colorRed)+"\nWARNING : place sell trigger @ "+ short_trigger,"")+

"\n"
;
m = 34;
BB28_3_top_3 = Ref(BBandTop(C,m,3),-3);
BB28_3_bot_3 = Ref(BBandBot(C,m,3),-3);
whitebarT = H > BB28_3_top_3 AND C < BB28_3_top_3;
whitebarB = C > BB28_3_bot_3 AND L < BB28_3_bot_3;

//PlotShapes(whitebarT*shapeSmallDownTriangle,colorWhite,0,H);
//PlotShapes(whitebarB*shapeSmallUpTriangle,colorWhite,0,L);
e3 = EMA(Close,3); e5 = EMA(Close,5);e8 = EMA(Close,8);e10 =EMA(Close,10);e12 =EMA(Close,12); e15 =EMA(Close,15);e20 =MA(Close,20);e25 =EMA(Close,25);e30 =EMA(Close,30);e35 =EMA(Close,35);e40 =EMA(Close,40);e45 =EMA(Close,45);e50 =EMA(Close,50);e55 =EMA(Close,55);e60 =EMA(Close,60);e65 =EMA(Close,65);e70 =EMA(Close,70);e75 =EMA(Close,75);e80 =EMA(Close,80);e85 =EMA(Close,85);e90 =EMA(Close,90);e95 =EMA(Close,95);e100 =EMA(Close,100);e105 =EMA(Close,105);e110 =EMA(Close,110);e115 =EMA(Close,115);e120 =EMA(Close,120);e125 =EMA(Close,125);e130 =EMA(Close,130);e135 =EMA(Close,135);e140 =EMA(Close,140);e145 =EMA(Close,145);e150 =EMA(Close,150);


Plot (e25,"",IIf(e25 > Ref(e25,-1),colorDarkGreen,colorDarkRed),styleNoLabel+styleThick+styleDashed);
Plot (e30,"",IIf(e30 > Ref(e30,-1),colorDarkGreen,colorDarkRed),styleNoLabel+styleThick+styleDashed);
Plot (e35,"",IIf(e35 > Ref(e35,-1),colorDarkGreen,colorDarkRed),styleNoLabel+styleThick+styleDashed);
Plot (e40,"",IIf(e40 > Ref(e40,-1),colorDarkGreen,colorDarkRed),styleNoLabel+styleThick+styleDashed);
Plot (e45,"",IIf(e45 > Ref(e45,-1),colorDarkGreen,colorDarkRed),styleNoLabel+styleThick+styleDashed);
Plot (e50,"",IIf(e50 > Ref(e50,-1),colorDarkGreen,colorDarkRed),styleNoLabel+styleThick+styleDashed);
Plot (e55,"",IIf(e55 > Ref(e55,-1),colorDarkGreen,colorDarkRed),styleNoLabel+styleThick+styleDashed);
Plot (e60,"",colorAqua,styleThick);


//Plot(2, "", colorWhite, styleOwnScale| styleArea|styleNoLabel,-0.5,100);


_SECTION_END();

RoundLotSize = 100;


PositionSize = 110*C;


_SECTION_BEGIN("Time Left");
function GetSecondNum()
{
    Time       = Now( 4 );
    Seconds    = int( Time % 100 );
    Minutes    = int( Time / 100 % 100 );
    Hours    = int( Time / 10000 % 100 );
    SecondNum = int( Hours * 60 * 60 + Minutes * 60 + Seconds );
    return SecondNum;
}
RequestTimedRefresh( 1 );
TimeFrame = Interval();
SecNumber = GetSecondNum();
Newperiod = SecNumber % TimeFrame == 0;
SecsLeft = SecNumber - int( SecNumber / TimeFrame ) * TimeFrame;
SecsToGo = TimeFrame - SecsLeft;

x=Param("xposn",918,0,1000,1);
y=Param("yposn",586,0,1000,1);

GfxSelectSolidBrush( ColorRGB( 230, 230, 230 ) );
GfxSelectPen( ColorRGB( 230, 230, 230 ), 2 );
if ( NewPeriod )
{
     GfxSelectSolidBrush( colorYellow );
   GfxSelectPen( colorYellow, 2 );
//   Say( "New period" );
}
GfxRoundRect( x+55, y+17, x-4, y-2, 0, 0 );
GfxSetBkMode(1);
GfxSelectFont( "Arial", 9, 700, False );
GfxSetTextColor( colorBlack );
GfxTextOut(  ""+SecsToGo+" / "+NumToStr( TimeFrame, 1.0 ), x, y );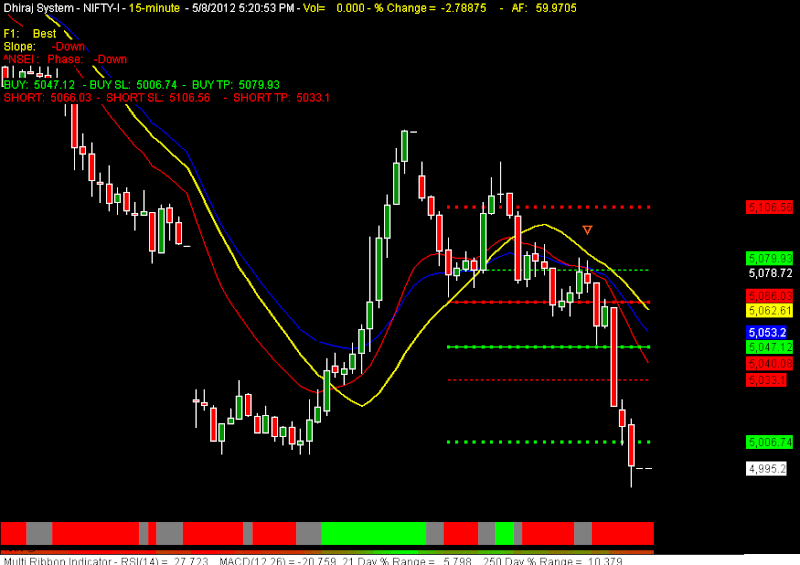
_SECTION_END();Dhiraj System
Code:
//File: Dhiraj Chart
SetChartBkColor(ParamColor("BackGround Color", colorBlack));
pShowRangeLines = ParamToggle("Show Range Lines", "No|Yes", 0);
pShowtradeLines = ParamToggle("Show Trade Lines", "No|Yes", 1);
pShowMarkers = ParamToggle("Show Markers", "No|Yes", 1);
synch1=ParamToggle("Show NR,s", "No|Yes", 0);
Limit=Param(" Trade Till (Hour)(Min)(Sec)",142500,103000,153000,100);
AFfilter =Param("Factor Filter",2,2,3,1);

_SECTION_BEGIN ("foreign Index bar graph");
synch=ParamToggle("Synch with Index", "No|Yes", 0);
Vr=ParamList("Index to Synch",List = "^NSEI,^NSEBANK,^CNXIT,^NSMIDCP,RELIANCE.NS,SBIN.NS",0);

_SECTION_BEGIN("P/L Settings");
PerctakeProfit=Param("Take Profit Percent",0.65,0.3,30,0.1);
PercStoploss=Param("StopLoss Percent",0.8,0.2,5,0.1);
trades1=Param("Trade Above",1,1,10,1);
riskAmount=Param("Risk Amount",240,200,10000,100);

_SECTION_BEGIN("Trade Variables");
Volmin=Param("Volume Min",0,0,10000000,50);
Volmax=Param("Volume Max",10000000,0,10000000,50);
priceRL=Param("Price Range Min",15,1,20000,1);
priceRH=Param("Price Range Max",20000,1,20000,1);
PercChangemin=Param("Percentage Change Min set", -50, -100, 100, 0.1);
PercChangemax=Param("Percentage Change Max set", 50, -100, 100, 0.1);

//Program computes and displays various price values in real time
//
// Today's Open
// Prior Day High
// Prior Day Low
// Prior Day Open
// Prior Day Close
// Prior Day Middle
// day 1015 High
// day 1015 Low

PlotOHLC(Open,High,Low,Close,"",colorWhite,styleCandle);
Bars  = 0;
xpdh  = 90;
_SECTION_BEGIN("SAR");
acc = Param("Acceleration", 0.02, 0, 1, 0.001 );
accm = Param("Max. acceleration", 0.2, 0, 1, 0.001 );
Plot( SAR( acc, accm ), _DEFAULT_NAME(), ParamColor( "color",colorBlack), ParamStyle("Style", styleDots | styleNoLine, maskDefault | styleDots | styleNoLine ) );
_SECTION_END();
_SECTION_BEGIN("SMA");
P = ParamField("Price field",-1);
Periods = Param("Periods", 20, 2, 300, 1, 10 );
Plot( MA( P, Periods ), _DEFAULT_NAME(), ParamColor( "Color", colorYellow ), ParamStyle("Style", styleThick) );
_SECTION_END();


//slopes
isSlopeUP=(MA( P, Periods )<L) AND Ref(MA( P, Periods ),-1)>Ref(MA( P, Periods ),-2) AND Ref(MA( P, Periods ),-2)>Ref(MA( P, Periods ),-3) AND Ref(MA( P, Periods ),-3)>Ref(MA( P, Periods ),-4);// AND Ref(MA( P, Periods ),-4)>Ref(MA( P, Periods ),-5) AND Ref(MA( P, Periods ),-5)>Ref(MA( P, Periods ),-6);
isSlopeDN=(MA( P, Periods )>H) AND Ref(MA( P, Periods ),-1)<Ref(MA( P, Periods ),-2) AND Ref(MA( P, Periods ),-2)<Ref(MA( P, Periods ),-3) AND Ref(MA( P, Periods ),-3)<Ref(MA( P, Periods ),-4);// AND Ref(MA( P, Periods ),-4)<Ref(MA( P, Periods ),-5) AND Ref(MA( P, Periods ),-5)<Ref(MA( P, Periods ),-6);
isSlpeUP=(MA( P, Periods )<C) AND Ref(MA( P, Periods ),-1)>Ref(MA( P, Periods ),-2) AND Ref(MA( P, Periods ),-1)>Ref(MA( P, Periods ),-3) AND Ref(MA( P, Periods ),-1)>Ref(MA( P, Periods ),-4) AND Ref(MA( P, Periods ),-1)>Ref(MA( P, Periods ),-5) AND Ref(MA( P, Periods ),-1)>Ref(MA( P, Periods ),-6);
isSlpeDN=(MA( P, Periods )>C) AND Ref(MA( P, Periods ),-1)<Ref(MA( P, Periods ),-2) AND Ref(MA( P, Periods ),-1)<Ref(MA( P, Periods ),-3) AND Ref(MA( P, Periods ),-1)<Ref(MA( P, Periods ),-4) AND Ref(MA( P, Periods ),-1)<Ref(MA( P, Periods ),-5) AND Ref(MA( P, Periods ),-1)<Ref(MA( P, Periods ),-6);

{
//Convert data to daily
Plot_Range = (TimeNum() >= 95500 AND TimeNum()<= 153500) AND (DateNum()==LastValue(DateNum()));
FH_Range   = (TimeNum() >= 095500 AND TimeNum()<= 101459) AND (DateNum()==LastValue(DateNum()));

FH_Prices  = High * FH_Range;
FH_Marker  = BarsSince(FH_Range>0);

//Find number of bars in 60 minutes
Num_Bars   = 3600 / Interval(1);

TimeFrameSet(inDaily);
TOP_        = Open;
PDH_        = Ref(High,-1);
PDL_        = Ref(Low,-1);
PDO_        = Ref(Open,-1);
PDC_        = Ref(Close,-1);
PDM_        = (PDH_+PDL_)/2;
TimeFrameRestore();
//
isAll = True;
isRth =  TimeNum() >= 095400 AND TimeNum() <= 101459;
isdRth =  TimeNum() >= 095400 AND TimeNum() <= 160000;

aRthL = IIf(isRth, L, 1000000);
aRthH = IIf(isdRth, H, Null);
aRthLd = IIf(isdRth, L, 1000000);

TOP         = TimeFrameExpand(TOP_,inDaily,expandFirst);
PDH         = TimeFrameExpand(PDH_,inDaily,expandFirst);
PDL         = TimeFrameExpand(PDL_,inDaily,expandFirst);
PDO         = TimeFrameExpand(PDO_,inDaily,expandFirst);
PDC         = TimeFrameExpand(PDC_,inDaily,expandFirst);
PDM         = TimeFrameExpand(PDM_,inDaily,expandFirst);
FHH        = Ref(HHV(High*FH_Range,Num_Bars),-FH_Marker);
FHL = TimeFrameCompress( aRthL, inDaily, compressLow );
FHL = TimeFrameExpand( FHL, inDaily, expandFirst );
DayH = TimeFrameCompress( aRthH, inDaily, compressHigh );
DayH = TimeFrameExpand( DayH, inDaily, expandFirst );
DayL = TimeFrameCompress( aRthLd, inDaily, compressLow );
DayL = TimeFrameExpand( DayL, inDaily, expandFirst );

//find factor
FC1=((PDH-PDL)*0.433);
FC2=((PDH-PDL)*0.7666);
FC3=((PDH-PDL)*1.355);
FC4=(FHH-FHL);

//NOW FILTER TO FIND THE APPLICABLE FACTOR
F11=IIf((FC4<=FC1+PDH*0.005),FC1,0);
F22=IIf((FC4<=FC2+PDH*0.005 AND FC4>FC1+PDH*0.005),FC2,0);
F33=IIf((FC4<=FC3 AND FC4>FC2+PDH*0.005),FC3,0);
element1=IIf(F11>0,F11,0);
element2=IIf(F22>0,F22,0);
element3=IIf(F33>0,F33,0);
AF=(F11+F22+F33);
since=(TimeNum() >= 101459 AND TimeNum()<= Limit) AND (DateNum()==LastValue(DateNum()));

//nr7 / nr1 /nr8

rang=High-Low;
nr7s=IIf(rang==LLV(rang,7) ,shapeDigit7+shapePositionAbove,shapeNone);
nr8s=IIf(Ref(nr7s,-1)  AND rang==LLV(rang,8) ,shapeDigit8+shapePositionAbove,shapeNone);
nr7=IIf(synch1,nr7s,0);
nr8=IIf(synch1,nr8s,0);
InsideBar = Inside() ;
nr1=IIf(nr7 AND InsideBar, shapeDigit1,shapeNone);

//foreign
SetForeign(Vr);
HaC =(O+H+L+C)/4;
HaO = AMA( Ref( HaC, -1 ), 0.5 );
HaH = Max( H, Max( HaC, HaO) );
HaL = Min( L, Min( HaC, HaO) );
BG3=HHV(LLV(HaL,4)+ATR(4),8);
BR3=LLV(HHV(HaH ,4)-ATR(4),8);
co = IIf(Hac>BG3 ,colorBrightGreen,IIf(Hac < BR3,colorRed,colorGrey50));
Plot(4, "", Co,styleArea+styleOwnScale | styleNoLabel, -1, 100);
RestorePriceArrays();
_SECTION_END();

//additional filters
GLong=(TOP==FHL);// AND TimeNum()<= 101600;
Gshort=(TOP==FHH);// AND TimeNum()<= 101600;
GLS=(AF<=(FHH-FHL));
advance=Foreign("NSE_Advancing","H");
decline=Foreign("NSE_Declining","H");

//NOW CALCULATE THE ENTRY-EXIT-STOPLOSS PARAMETERS
BuyPrice=(DayL+AF);
BuyTP1=(BuyPrice+(BuyPrice*(PerctakeProfit/100)));
BuyTP2=(C>=BuyTP1 OR H>=BuyTP1 );
SellPrice=(DayH-AF);
SellTP1=(SellPrice-(SellPrice*(PerctakeProfit/100)));
SellTP2=(C<=SellTP1 OR L<=SellTP1);
TSB= IIf(SAR(acc,accm)>BuyTP1 AND SAR(acc,accm)<L,SAR(acc,accm),BuyTP1);
TSB1=Cross(TSB,C);
TSS= IIf(SAR(acc,accm)<SellTP1 AND SAR(acc,accm)>H,SAR(acc,accm),SellTP1);
TSS1=Cross(C,TSS);
percchange=(((C-PDC)/PDC)*100);
Vol=(V>=Volmin AND V<=Volmax);
Percentage=(percchange>=PercChangemin AND percchange<=PercChangemax);
prc=(C>=priceRL AND C<=priceRH);
Buy1=(Vol AND Percentage AND prc  AND since AND (Hac>BG3) AND advance>=Decline AND (Cross(C,BuyPrice)));
Buy2=(Vol AND Percentage AND prc  AND since AND advance>=Decline AND (Cross(C,BuyPrice)));
Short1= (Vol AND Percentage AND prc AND  since AND advance<=Decline AND (Hac<BR3) AND (Cross(SellPrice,C)));
Short2= (Vol AND Percentage AND prc AND  since AND advance<=Decline AND (Cross(SellPrice,C)));
Buy3 =  IIf(synch,Buy1,Buy2);
Short3= IIf(synch,Short1,Short2);
BuyStop1=(BuyPrice-(BuyPrice*(PercStoploss/100)));
//BuyStop1=IIf(BuyStop1<= SellPrice, SellPrice, BuyStop1 );
BuyStop2=(L<=BuyStop1 OR C<=BuyStop1);
SellStop1=(SellPrice+(SellPrice*(PercStoploss/100)));
//SellStop1=IIf(SellStop1 >= BuyPrice, BuyPrice, SellStop1);
SellStop2=(H>=SellStop1 OR C>=SellStop1);

//cumulative trades
tradebase=(Buy3 OR Short3 AND since);
trades=Cum(tradebase);
trades2=(trades>=trades1);

//buyTargetHit= IIf(buySince>=1 AND buyTPSince>=1 AND  buyStopSince <= 0,   1, 0);
//buyStoplossHit= IIf(buySince>=1 AND buyStopSince>=1 AND  buyTPSince <= 0,   1, 0);


Buy=(Buy3 AND trades2 AND isSlopeUP AND (NOT Ref(Buy3,-1) AND NOT Ref(Buy3,-2) AND NOT Ref(Buy3,-3) AND NOT Ref(Buy3,-4) AND NOT Ref(Buy3,-5))) ;
Short=(Short3  AND trades2 AND isSlopeDN AND (NOT Ref(Short3,-1) AND NOT Ref(Short3,-2) AND NOT Ref(Short3,-3)  AND NOT Ref(Short3,-4) AND NOT Ref(Short3,-5))) ;
BuyStop=IIf((Buy AND NOT BuyTP2),BuyStop1,Null);
SellStop=IIf(Short AND NOT SellTP2,SellStop1,Null);
BuyTP=IIf(Buy AND NOT BuyStop,BuyTP2,Null);
SellTP=IIf(Short AND NOT SellStop,SellTP2,Null);


//experiment
tradebaseB=(Buy);
tradesB=Cum(tradebaseB);

BuyTP3=BuyTP2 AND TradesB>=1;
tradebaseBTP=(BuyTP3);
tradesBTP=Cum(tradebaseBTP);

Buystop3=Buystop2 AND TradesB>=1;
tradebaseBSL=(Buystop3 AND since);
tradesBSL=Cum(tradebaseBSL);

tradebaseS=(Short);
tradesS=Cum(tradebaseS);

SellTP3=SellTP2 AND TradesS>=1;
tradebaseSTP=(SellTP3);
tradesSTP=Cum(tradebaseSTP);

Sellstop3=Sellstop2 AND TradesS>=1;
tradebaseSSL=(Sellstop3 AND since);
tradesSSL=Cum(tradebaseSSL);

buyTriggered = (TradesB==1);
buyTargetHit= (TradesBTP>=1);
buyStoplossHit= (TradesBSL>=1);

shortTriggered = TradesS==1;
shortTargetHit= (TradesSTP>=1);
shortStoplossHit= (TradesSSL>=1);
//end


//line plot basics
Bars       = BarsSince(TimeNum() >= 95400 AND TimeNum() < 101459);//,BarIndex(),1); // AND DateNum()==LastValue(DateNum());
x0         = BarCount-LastValue(Bars);
x1         = BarCount-1;
TOP_Line   = LineArray(x0,LastValue(TOP),x1,LastValue(TOP),0);
PDH_Line   = LineArray(x0,LastValue(PDH),x1,LastValue(PDH),0);
PDL_Line   = LineArray(x0,LastValue(PDL),x1,LastValue(PDL),0);
PDC_Line   = LineArray(x0,LastValue(PDC),x1,LastValue(PDC),0);
PDM_Line   = LineArray(x0,LastValue(PDM),x1,LastValue(PDM),0);
FHH_Line   = LineArray(x0,LastValue(FHH),x1,LastValue(FHH),0);
FHL_Line   = LineArray(x0,LastValue(FHL),x1,LastValue(FHL),0);
BuyPriceline=LineArray(x0,LastValue(BuyPrice),x1,LastValue(BuyPrice),0);
BuyStopline=LineArray(x0,LastValue(BuyStop1),x1,LastValue(BuyStop1),0);
BuyTPline=LineArray(x0,SelectedValue(TSB),x1,SelectedValue(TSB),0);
SellPriceline=LineArray(x0,LastValue(SellPrice),x1,LastValue(SellPrice),0);
SellStopline=LineArray(x0,LastValue(SellStop1),x1,LastValue(SellStop1),0);
SellTPline=LineArray(x0,SelectedValue(TSS),x1,SelectedValue(TSS),0);
DayHline=LineArray(x0,LastValue(DayH),x1,LastValue(DayH),0);
DayLline=LineArray(x0,LastValue(DayL),x1,LastValue(DayL),0);

//Ready codes
//Cshavebuy1=IIf((C>=((BuyStopline)) AND H<=BuyPriceline) AND NOT Short,Buystopline+(2*((Ref(High,-1)-Ref(Low,-1))*factor/100)),0);
//Cshavesell1=IIf((C<=((Sellstopline)) AND L>=SellPriceline) AND NOT Buy,SellStopline-(2*((Ref(High,-1)-Ref(Low,-1))*factor/100)),0);
Cshavebuy1=IIf((C>BuyStopline AND H<=BuyPriceline AND H > BuyPriceline*0.997) AND NOT Short AND since,(BuyPriceline*0.997),0);
Cshavesell1=IIf((C<Sellstopline AND L>=SellPriceline AND L<SellPriceLine*1.002) AND NOT Buy AND since,(SellPriceLine*1.002),0);
Cshavebuy2=Cshavebuy1 AND (NOT Ref(Cshavebuy1,1) AND isSlopeUP);
Cshavebuy3=Cshavebuy1 AND (NOT Ref(Cshavebuy1,1) AND ((Hac>BG3) OR (NOT (Hac>BG3) AND NOT (Hac<BR3))) AND isSlopeUP);
Cshavesell2=CshaveSell1  AND (NOT Ref(Cshavesell1,1) AND isSlopeDN);
Cshavesell3=CshaveSell1  AND (NOT Ref(Cshavesell1,1) AND ((Hac<BR3) OR (NOT (Hac>BG3) AND NOT (Hac<BR3))) AND isSlopeDN);
Cshavebuy= IIf(Synch,Cshavebuy3,Cshavebuy2);
Cshavesell=IIf(synch,Cshavesell3,Cshavesell2);

//Cshavesell1	=(L<=((Sellstop1)) AND L>=SellPrice AND since);
//Cshavebuy=Cshavebuy1 AND (NOT Ref(Cshavebuy1,-1) AND NOT Ref(Cshavebuy1,1) );// AND synch;//AND isSlopeUP
//Cshavesell=CshaveSell1  AND (NOT Ref(Cshavesell1,-1) AND NOT Ref(Cshavesell1,-1));// AND synch;//AND isSlopeDN


//title
/*
buySince=  BarsSince(Buy ); // buy is triggered since how many bars back
buyStopSince= BarsSince(IIf(Buysince>=0,BuyStop2 AND since,0)); // buy SL is triggered since how many bars back
buyTPSince= BarsSince(IIf(Buysince>=0,BuyTP2 AND since,0)); // buy TP is triggered since how many bars back

//buyTriggered = IIf(buySince>=0 ,1,0);
//buyTargetHit= IIf(buySince>=0 AND buyTPSince>=0 AND  buySince >= buyTPSince ,   1, 0);
//buyStoplossHit= IIf( buySince>=0 AND buyStopSince>=0 AND  buySince >= buyStopSince ,   1, 0);

shortSince=  BarsSince(Short); // short is triggered since how many bars back
shortStopSince= BarsSince(IIf(shortSince>=0,SellStop2 AND since,0)); // short SL is triggered since how many bars back
shortTPSince= BarsSince(IIf(shortSince>=0,SellTP2 AND since,0)); // short TP is triggered since how many bars back

shortTriggered = IIf(shortSince>=0,1,0);
shortTargetHit= IIf(shortSince>=0 AND shortTPSince>=0 AND  shortSince>=shortTPSince,   1, 0);
shortStoplossHit= IIf(shortSince>=0 AND shortStopSince>=0 AND  shortSince>=shortStopSince,   1, 0);
*/


//money management
lotSize = round((riskAmount/(BuyPrice-BuyStop1)));

//PLOT LINES
Plot(IIf(pShowtradeLines,BuyPriceline,Null),"Buy Here",colorBrightGreen,styleDots|styleNoRescale);
Plot(IIf(pShowtradeLines,BuyStopline,Null),"BuyStop",colorBrightGreen,styleDots|styleNoRescale| styleNoLine);
Plot(IIf(pShowtradeLines,BuyTPline,Null),"Buy Take profit",colorBrightGreen,styleDashed|styleNoRescale);
//Plot(IIf(pShowtradeLines,Cshavebuyline,Null),"Ready Long",colorLime,styleDashed|styleNoRescale);
Plot(IIf(pShowtradeLines,SellPriceline,Null),"Short Here",colorRed,styleDots|styleNoRescale);
Plot(IIf(pShowtradeLines,SellStopline,Null),"ShortStop",colorRed,styleDots|styleNoRescale| styleNoLine);
Plot(IIf(pShowtradeLines,SellTPline,Null),"Short Take Profit",colorRed,styleDashed|styleNoRescale);
//Plot(IIf(pShowtradeLines,Cshavesellline,Null),"Ready Short",colorOrange,styleDashed|styleNoRescale);
Plot(IIf(pShowRangeLines,TOP_Line,Null),"Open",colorGreen,styleDashed|styleNoRescale);
Plot(IIf(pShowRangeLines,PDH_Line,Null),"PDH",colorPlum,styleLine|styleNoRescale);
Plot(IIf(pShowRangeLines,PDL_Line,Null),"PDL",colorPlum,styleLine|styleNoRescale);
Plot(IIf(pShowRangeLines,DayHline,Null),"DayH",colorYellow,styleLine|styleNoRescale);
Plot(IIf(pShowRangeLines,DayLline,Null),"DayL",colorYellow,styleLine|styleNoRescale);
Plot(IIf(pShowRangeLines,FHH_Line,Null),"1015H",IIf(FH_Range==1,Null,colorBlue),styleLine|styleNoRescale);
Plot(IIf(pShowRangeLines,FHL_Line,Null),"1015L",IIf(FH_Range==1,Null,colorBlue),styleLine|styleNoRescale);


//Shapes
PlotShapes(nr1,colorGreen,0,L);
PlotShapes(nr7,colorGreen,0,H);
PlotShapes(nr8,colorRed,0,(L-(H-L)/4));
PlotShapes(IIf(pShowMarkers AND Short, shapeDownArrow, Null), colorOrange, 0,H,Offset=-15);
PlotShapes(IIf(pShowMarkers AND Buy, shapeUpArrow, Null), colorWhite, 0,L,Offset=-15);
PlotShapes(IIf(pShowMarkers AND Cshavesell, shapeHollowSmallDownTriangle, Null), colorOrange, 0,H,Offset=-35);
PlotShapes(IIf(pShowMarkers AND Cshavebuy, shapeHollowSmallUpTriangle, Null), colorWhite, 0,L,Offset=-35);


//Alerts
AlertIf( Buy, "SOUND C:\\Windows\\Media\\Windows XP Startup.wav", "Buy",2);
AlertIf( Short, "SOUND C:\\Windows\\Media\\Windows XP Startup.wav", "Short", 2 );
AlertIf( BuyStop, "SOUND C:\\Windows\\Media\\Ringin.wav", "BuyStop Hit", 2 );
AlertIf( TSB1, "SOUND C:\\Windows\\Media\\Ringin.wav", "Buy Take Profit", 2 );
AlertIf( SellStop, "SOUND C:\\Windows\\Media\\Ringin.wav", "Short Stop Hit", 2 );
AlertIf( TSS1, "SOUND C:\\Windows\\Media\\Ringin.wav", "Short Take Profit", 2 );
AlertIf( Cshavebuy, "SOUND C:\\Windows\\Media\\Windows XP Startup.wav", "Get Ready to Buy", 2 );
AlertIf( Cshavesell, "SOUND C:\\Windows\\Media\\Windows XP Startup.wav", "Get Ready to Short", 2 );
//AlertIf( GLong, "SOUND C:\\Windows\\Media\\Windows XP Startup.wav", "Open = 1015L Buy", 2 );
//AlertIf( Gshort, "SOUND C:\\Windows\\Media\\Windows XP Startup.wav", "Open = 1015H Short", 2 );
//AlertIf( GLS, "SOUND C:\\Windows\\Media\\Windows XP Startup.wav", "Factor>=Range, Go Long or Short sure shot", 2 );


//commentary

if( Status("action") == actionIndicator )
(
Title = EncodeColor(colorWhite)+ "Dhiraj System" + " - " +  Name() + " - " + EncodeColor(colorYellow)+ Interval(2) + EncodeColor(colorWhite) +
 "  - " + Date() +" - " +EncodeColor(colorYellow) + "Vol= "+ WriteVal(V)+" - "+ WriteIf(Percchange, "% Change =  "+(Percchange)+"  ","")+
WriteIf(GLS, "   -  FactorFriendlyBothSides  "+(GLS)+"  ","")+
WriteIf(trades, "   -Trade #:   "+(Trades)+"  ","")+
WriteIf(AF, "   -   AF:   "+(AF)+"  ","")+
WriteIf((lotSize) AND since, " -  Position Size :  "+( lotSize )+"  ","")+
"\n"+"\n"+

WriteIf(F11, "F1:     Best "+"  ","")+
WriteIf(F22, "F2:     Medium "+"  ","")+
WriteIf(F33, "F3:     No Good"+"  ","")+
WriteIf(F33, "F3:     No Good"+"  ","")+
Comm2=("\n"+"Slope:      ")+
WriteIf(isSlopeUP,EncodeColor(colorBrightGreen)+"+Up",
WriteIf(isSlopeDN,EncodeColor(colorRed)+"-Down",EncodeColor(colorLightYellow)+"< Flat >"))+
Comm2=("\n"+Vr+" :   Phase:    ")+
WriteIf(Hac>BG3,EncodeColor(colorBrightGreen)+"+Up",
WriteIf(Hac<BR3,EncodeColor(colorRed)+"-Down",EncodeColor(colorLightYellow)+"< Flat >"))+

"\n"+"\n"+
EncodeColor(colorBrightGreen) +
WriteIf(BuyPrice, "BUY:  "+(BuyPrice)+"  ","")+
WriteIf(BuyStop1, " - BUY SL:  "+(BuyStop1),"")+
WriteIf(TSB , "  -  BUY TP:  "+(TSB)+" ","")+
"\n"+
EncodeColor(colorRed) +
WriteIf(SellPrice, "SHORT:  "+(SellPrice)+"  ","")+
WriteIf(SellStop1, "-  SHORT SL:  "+(SellStop1)+"  ","")+
WriteIf(TSS, "   -  SHORT TP:  "+(TSS)+"  ","")+"\n"+
"\n"+
EncodeColor(colorBrightGreen) +
WriteIf(GLong, "Open=1015L Bullish:  "+(GLong)+"  ","")+
EncodeColor(colorRed) +
WriteIf(Gshort, "Open=1015H Bearish:  "+(Gshort)+"  ","")+
"\n"+
EncodeColor(colorBrightGreen) +
WriteIf(advance, "Advance:  "+(advance)+"  ","")+
EncodeColor(colorRed) +
WriteIf(decline, "   -  Decline:  "+(Decline)+"  ",""));


//"\n"+

//WriteVal(NSE_Advancing)+ WriteVal(CshaveSell)+ WriteVal(Buy));

//exploration
AddColumn( IIf(Cshavebuy, 82, IIf(Cshavesell, 82,01 )), "READY", formatChar, IIf(Cshavesell,colorDarkRed,colorGreen) );
AddColumn( IIf(Buy, 66, IIf(Short, 83,01 )), "ACTION ", formatChar, IIf(Short,colorDarkRed,colorGreen) );
AddTextColumn(
WriteIf(element1,"F1",
WriteIf(element2,"F2",
WriteIf(element3,"F3",
""))),"ELEMENT",1.0,
IIf((element1 OR element2),colorDarkGreen,colorDarkRed));
/*AddTextColumn(
WriteIf(BuytargetHit,"buyTargetHit",
WriteIf(buyStoplossHit,"buyStoplossHit",
WriteIf(shortTargetHit ,"shortTargetHit ",
WriteIf(shortStoplossHit,"shortStoplossHit",
"")))),"Status",1.0,
IIf((buyTargetHit OR shortTargetHit OR BuyTriggered),colorDarkGreen,colorDarkRed));*/
AddColumn(BuyPrice,"Buy",1.2);
AddColumn(BuyStop1,"Buy SL",1.2);
AddColumn(TSB,"Buy TP",1.2);
AddColumn(SellPrice,"Short",1.2);
AddColumn(SellStop1,"Short SL",1.2);
AddColumn(TSS,"Short TP",1.2);
//AddColumn(Glong,"Open=1015LBuy",1.0);
//AddColumn(Gshort,"Open=1015H Short",1.0);
//AddColumn(GLS,"FactorFriendly",1.0);
//AddColumn(trades,"TradeNo.",1.0);
//Filter= IIf(AFfilter==2,((Buy OR  Short OR Cshavebuy OR Cshavesell OR buyTargetHit OR buyStoplossHit OR shortTargetHit OR shortStoplossHit AND (element1 OR element2))),((Buy OR  Short OR Cshavebuy OR Cshavesell OR buyTargetHit OR buyStoplossHit OR shortTargetHit OR shortStoplossHit) AND (element1 OR element2 OR element3)));// OR  GLong OR Gshort);// AND trades2 AND GLS;
//}
//OR buyTargetHit OR buyStoplossHit OR shortTargetHit OR shortStoplossHit
Filter= IIf(AFfilter==2,Buy OR  Short OR Cshavebuy OR Cshavesell AND (element1 OR element2),Buy OR  Short OR Cshavebuy OR Cshavesell AND (element1 OR element2 OR element3));// OR  GLong OR Gshort);// AND trades2 AND GLS;
}

_SECTION_BEGIN("EMA");
P = ParamField("Price field",-1);
Periods = Param("Periods", 15, 2, 300, 1, 10 );
Plot( EMA( P, Periods ), _DEFAULT_NAME(), ParamColor( "Color", colorCycle ), ParamStyle("Style") );
_SECTION_END();

_SECTION_BEGIN("EMA1");
P = ParamField("Price field",-1);
Periods = Param("Periods", 15, 2, 300, 1, 10 );
Plot( EMA( P, Periods ), _DEFAULT_NAME(), ParamColor( "Color", colorCycle ), ParamStyle("Style") );
_SECTION_END();
Last edited:
- Status
- Not open for further replies.
| Thread starter | Similar threads | Forum | Replies | Date |
|---|---|---|---|---|
|
|
My visual effect afl collection. | AmiBroker | 185 | |
|
|
AFL Collection by Tamil Trader | AmiBroker | 10 | |
| P | AFL Collection without formula references FUTURE quotes | AmiBroker | 1 | |
|
|
My amibroker afl collections | AmiBroker | 18 | |
|
|
The Grand AFL Collection Thread | AmiBroker | 20 |
Similar threads
-

-

-
AFL Collection without formula references FUTURE quotes
- Started by pareshbhangale
- Replies: 1
-
-
