SetChartOptions(0, chartShowDates | chartWrapTitle | chartShowArrows);
_SECTION_BEGIN("Background");
SetChartBkColor(ParamColor("Background Color", colorBlack));
_SECTION_END();
_SECTION_BEGIN("Chart");
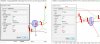
Plot(C, "Chart Style", ParamColor("Chart Color", colorWhite), ParamStyle("Chart Type", styleCandle, maskPrice));
_SECTION_END();
_SECTION_BEGIN("MA 1");
P1 = ParamField("Price Field", 3);
Periods1 = Param("Periods", 5, 2, 100, 0.5);
Plot(MA(P1, Periods1), _DEFAULT_NAME(), ParamColor("Color", colorRed), ParamStyle("Style", styleLine));
_SECTION_END();
_SECTION_BEGIN("MA 2");
P2 = ParamField("Price Field", 3);
Periods2 = Param("Periods", 6, 3, 200, 1);
Plot(MA(P2, Periods2), _DEFAULT_NAME(), ParamColor("Color", colorGreen), ParamStyle("Style", styleLine));
_SECTION_END();
_SECTION_BEGIN("Bollinger Band");
P3 = ParamField("Price Field", 3);
Periods3 = Param("Periods", 9, 2, 100, 1);
Width = Param("Width", 2, 0, 10, 0.5);
Color = ParamColor("Color", colorBlue);
Style = ParamStyle("Style", styleLine);
Plot(BBandTop(P3, Periods3, Width), "BBTop" + _PARAM_VALUES(), Color, Style);
Plot(BBandBot(P3, Periods3, Width), "BBBot" + _PARAM_VALUES(), Color, Style);
_SECTION_END();
MA1 = MA(P1, Periods1);
MA2 = MA(P2, Periods2);
Buy = Cross(MA1, MA2);
Sell = Cross(MA2, MA1);
Buy = ExRem(Buy, Sell);
Sell = ExRem(Sell, Buy);
PlotShapes(IIf(Buy,shapeUpArrow,shapeNone),colorYellow,0,Graph0);
PlotShapes(IIf(Sell,shapeDownArrow,shapeNone),colorOrange,0,Graph1);


")