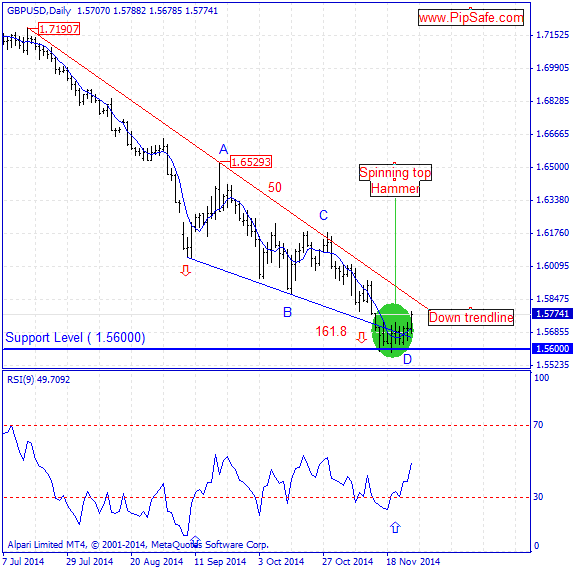
EUR/NZD during the recent days was in a strong and consistent down trend that sellers were successful in achieving the lowest price of 1.57211 .Price has been stopped from more descending with reaching to the up trend line made of 2 supportive points (some sellers used these levels to leave their trades) during descending .
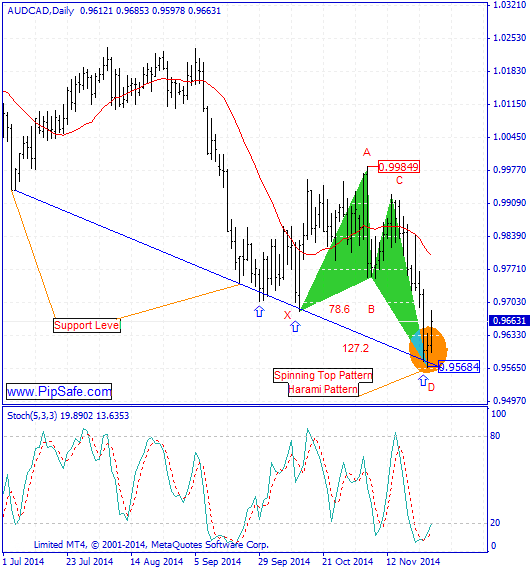
As it is obvious in the picture below, there is Gartley harmonic pattern between the top price of 1.64425 and the bottom price of 1.57211 that there is a potential for ceasing of price from D point of this pattern. Stoch indicator is in saturation sell area in daily time frame that warns the potential of formation of a bottom price and a little price reformation in this range. Generally according to the current situation of the price chart in daily time frame until the third point of up trend line is preserved, the price will have the potential to ascend and pass the mentioned bottom price.

As it is obvious in the picture below, there is Gartley harmonic pattern between the top price of 1.64425 and the bottom price of 1.57211 that there is a potential for ceasing of price from D point of this pattern. Stoch indicator is in saturation sell area in daily time frame that warns the potential of formation of a bottom price and a little price reformation in this range. Generally according to the current situation of the price chart in daily time frame until the third point of up trend line is preserved, the price will have the potential to ascend and pass the mentioned bottom price.