hi ,
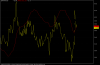
i'm trying to plot a chart that consists of closing price ema and the diff between them it works fine but obviously it's useless because i can't realy see the diff it's very low and allmost looks like a straight line , is there a way to have two range axis in one chart ?
thanks .
attached is the afl :
_SECTION_BEGIN("MAIN");
Plot(Close,"Close",colorBlack,styleLine );
P = ParamField("Price field",-1);
Periods = Param("Periods", 15, 2, 200, 1 );
Plot( EMA( P, Periods ), _DEFAULT_NAME(), ParamColor( "Color", colorCycle ), ParamStyle("Style") );
diff = Close - EMA (Close,Periods) ;
Plot(diff,"",colorYellow,styleLine );
_SECTION_END();