


Friends,
I have not been strictly following the rules of logging each trade and reviewing it, and the results have been equally haphazard. I am posting them publicly as this will motivate me. Also, your suggestions would help me improve.
Came across this strategy on Renko: http://renkotraders.com/renko-trading-strategy/renko-trend-and-timing-strategy/
Renko seems to reduce our confusion when the market whipsaws, and generally the stops are hit fewer times. It also shows the key levels more clearly.
Inidcators and other details:
LONG: When Stochastics is bullish and price bounces upward off LBB or MBB. Exit when brick changes to red
SHORT: When Stochastics is bearsh and price bounces downward off UBB or MBB. Exit when brick changes to green.
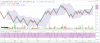
The chart looks like this:

Gold has broken out of the UBB when it was horizontal (ranging). So will be going LONG tomorrow. Otherwise I'd have shorted as soon as a red candle formed after the Stochastics turns bearish.
This move may not last long as it is near the high formed in July.
I have not been strictly following the rules of logging each trade and reviewing it, and the results have been equally haphazard. I am posting them publicly as this will motivate me. Also, your suggestions would help me improve.
Came across this strategy on Renko: http://renkotraders.com/renko-trading-strategy/renko-trend-and-timing-strategy/
Renko seems to reduce our confusion when the market whipsaws, and generally the stops are hit fewer times. It also shows the key levels more clearly.
Inidcators and other details:
- Stochastics oscillator: 5, 3, 3 setting with 80 and 20 determining the overbought and oversold levels.
- Slightly modified the MA in the original strategy (in the link) to the middle Bollinger band (default settings).
- Renko Bricks: ATR based auto select
- Daily TF.
- Instrument: GoldPetal
- Initial Capital: 1000
LONG: When Stochastics is bullish and price bounces upward off LBB or MBB. Exit when brick changes to red
SHORT: When Stochastics is bearsh and price bounces downward off UBB or MBB. Exit when brick changes to green.
The chart looks like this:
Gold has broken out of the UBB when it was horizontal (ranging). So will be going LONG tomorrow. Otherwise I'd have shorted as soon as a red candle formed after the Stochastics turns bearish.
This move may not last long as it is near the high formed in July.
Attachments
-
 118.3 KB Views: 44
Last edited:
")