


Respected senior members and my dear friends,
I am trying to plot some text below the nth occurrence of a trough. After lots of trial and error, I was able to do so, but my code is quite lengthy and messy. I feel that there has to be an easier and better way to achieve the same.
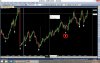
My query is that, can some senior member please kindly give some suggestions or provide a better and simpler way to plot that circled 7 ( circled 7 is in the pic that I have attached ).
Lastly, I would like to thank Tomasz Sir for creating such a wonderful masterpiece called Amibroker, and all the senior members for sharing their invaluable knowledge.
Awaiting your replies.
Thank you.
Following is the code :-
I am trying to plot some text below the nth occurrence of a trough. After lots of trial and error, I was able to do so, but my code is quite lengthy and messy. I feel that there has to be an easier and better way to achieve the same.
My query is that, can some senior member please kindly give some suggestions or provide a better and simpler way to plot that circled 7 ( circled 7 is in the pic that I have attached ).
Lastly, I would like to thank Tomasz Sir for creating such a wonderful masterpiece called Amibroker, and all the senior members for sharing their invaluable knowledge.
Awaiting your replies.
Thank you.
Following is the code :-
Code:
//Plotting text below the nth occurrence of a trough

//plotting price
Plot( C, "", colorDefault , stylecandle );

//nth occurence of trough to be plotted below
n = 7;

//condition to find low of trough when trough was found
lcond = L == ( Trough( L, 20 ) );

//counting the number of times condition was fulfilled
countcond = LastValue( Cum( lcond ) );

//adjusting the nth occurrence :) to look right on chart :) this step is probably not needed :) searching for a better solution :)
ncount = countcond - n + 1 ;

//condition to plot text below the nth trough :)
nth = L == Lastvalue( ( ValueWhen( lcond, L, ncount ) ) );

//numbering troughs for better understanding
troughs = 0;

for( i = 0; i < BarCount; ++i )
{

//Plotting text below all troughs
    if( lcond[i] )
    {
        troughs++;
        PlotTextSetFont( "" + troughs , "Arial Black", 20, i, L[i], Colorwhite, colorDefault, -20 );
    }

//Plotting text below the nth trough
    if( nth[i] )
    {
        PlotTextSetFont( "" + n , "Arial Black", 20, i, L[i], Colorwhite, colorDefault, -60 );
    }
}
Attachments
-
 384.1 KB Views: 61