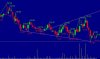
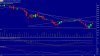
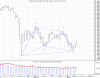
lol thanks guys, its weekly chart of mahindra ugine, the RSI & MACD +ve divergence is what interested me... its that I recognize patterns but to know the name & implication is still tough of the pattern, higher tops & lower bottoms... actually I spotted this at 80 & then it rallied to 118, but the pattern is still on...
as you see last time it made a bottom at 70 & retested it at 71, now its doing a similar pattern... it would be nice to trade with trendline bottom as a stop... cause this time it would give more than 100% profit, if it continues...