


Need this AFL seniors help me ..
- Thread starter bstar
- Start date
sukhinder sir pls share or send m me mail also mail id is [email protected]
_SECTION_BEGIN("MyMagic");
SetBarsRequired(100000,0);
GraphXSpace = 15;
SetChartOptions(0,chartShowArrows|chartShowDates);
SetChartBkColor(ParamColor("bkcolor",ColorRGB(0,0, 0)));
GfxSetBkMode(0);
GfxSetOverlayMode(1);
SetBarFillColor(IIf(C>O,ParamColor("Candle UP Color", colorGreen),IIf(C<=O,ParamColor("Candle Down Color", colorRed),colorLightGrey)));
//Plot(C,"\nPrice",IIf(C>O,ParamColor("Wick UP Color", colorDarkGreen),IIf(C<=O,ParamColor("Wick Down Color", colorDarkRed),colorLightGrey)),64,0,0,0,0);
SetTradeDelays(1,1,1,1);
HaClose = (O + H + L + C)/4;
HaOpen = AMA( Ref( HaClose, -1 ), 0.5 );
HaHigh = Max( H, Max( HaClose, HaOpen ) );
HaLow = Min( L, Min( HaClose, HaOpen ) );
xDiff = (HaHigh - Halow) * 10000;
barcolor = IIf(HaClose >= HaOpen,colorGreen,colorRed);
PlotOHLC( HaOpen, HaHigh, HaLow, HaClose, "", barcolor, styleCandle );
_N(Title = StrFormat("{{NAME}} - {{INTERVAL}} {{DATE}} Open %g, Hi %g, Lo %g, Close %g (%.1f%%) {{VALUES}}", O, H, L, C, SelectedValue( ROC( C, 1 ) ) ));
Factor=Param("Factor",2,1,10,0.1);
Pd=Param("ATR Periods",11,1,100,1);
Up=(H+L)/2+(Factor*ATR(Pd));
Dn=(H+L)/2-(Factor*ATR(Pd));
iATR=ATR(Pd);
TrendUp=TrendDown=Null;
trend[0]=1;
changeOfTrend=0;
flag=flagh=0;
for (i = 1; i <BarCount-1; i++) {
TrendUp = Null;
TrendDown = Null;
trend=1;
if (Close>Up[i-1]) {
trend=1;
if (trend[i-1] == -1) changeOfTrend = 1;
}
else if (Close<Dn[i-1]) {
trend=-1;
if (trend[i-1] == 1) changeOfTrend = 1;
}
else if (trend[i-1]==1) {
trend=1;
changeOfTrend = 0;
}
else if (trend[i-1]==-1) {
trend=-1;
changeOfTrend = 0;
}
if (trend<0 && trend[i-1]>0) {
flag=1;
}
else {
flag=0;
}
if (trend>0 && trend[i-1]<0) {
flagh=1;
}
else {
flagh=0;
}
if (trend>0 && Dn<Dn[i-1]){
Dn=Dn[i-1];
}
if (trend<0 && Up>Up[i-1])
{ Up=Up[i-1];
}
if (flag==1)
{ Up=(H+L)/2+(Factor*iATR);;
}
if (flagh==1)
{ Dn=(H+L)/2-(Factor*iATR);;
}
if (trend==1) {
TrendUp=Dn;
if (changeOfTrend == 1) {
TrendUp[i-1] = TrendDown[i-1];
changeOfTrend = 0;
}
}
else if (trend==-1) {
TrendDown=Up;
if (changeOfTrend == 1) {
TrendDown[i-1] = TrendUp[i-1];
changeOfTrend = 0;
}
}
}
Plot(TrendUp,"Trend",colorGreen);
Plot(TrendDown,"Down",colorRed);
Buy = trend==1;
Sell=trend==-1;
Buy=ExRem(Buy,Sell);
Sell=ExRem(Sell,Buy);
Short=Sell;
Cover=Buy;
BuyPrice=ValueWhen(Buy,C);
SellPrice=ValueWhen(Sell,C);
ShortPrice=ValueWhen(Short,C);
CoverPrice=ValueWhen(Cover,C);
Title = EncodeColor(colorWhite)+ "My Magic AFL" + " - " + Name() + " - " + EncodeColor(colorRed)+ Interval(2) + EncodeColor(colorWhite) +
" - " + Date() +" - "+"\n" +EncodeColor(colorRed) +"Op-"+O+" "+"Hi-"+H+" "+"Lo-"+L+" "+
"Cl-"+C+" "+ "Vol= "+ WriteVal(V)+"\n"+
EncodeColor(colorLime)+
WriteIf (Buy , " GO LONG / Reverse Signal at "+C+" ","")+
WriteIf (Sell , " EXIT LONG / Reverse Signal at "+C+" ","")+"\n"+EncodeColor(colorYellow)+
WriteIf(Sell , "Total Profit/Loss for the Last Trade Rs."+(C-BuyPrice)+"","")+
WriteIf(Buy , "Total Profit/Loss for the Last trade Rs."+(SellPrice-C)+"","");
PlotShapes(IIf(Buy, shapeSquare, shapeNone),colorGreen, 0, L, Offset=-40);
PlotShapes(IIf(Buy, shapeSquare, shapeNone),colorLime, 0,L, Offset=-50);
PlotShapes(IIf(Buy, shapeUpArrow, shapeNone),colorWhite, 0,L, Offset=-45);
PlotShapes(IIf(Short, shapeSquare, shapeNone),colorRed, 0, H, Offset=40);
PlotShapes(IIf(Short, shapeSquare, shapeNone),colorOrange, 0,H, Offset=50);
PlotShapes(IIf(Short, shapeDownArrow, shapeNone),colorWhite, 0,H, Offset=-45);
TrendSL=IIf(trend==1,TrendUp,TrendDown);
for(i=BarCount-1;i>1;i--)
{
if(Buy == 1)
{
entry = C;
sig = "BUY";
sl = TrendSL;
tar1 = entry + (entry * .0050);
tar2 = entry + (entry * .0092);
tar3 = entry + (entry * .0179);
bars = i;
i = 0;
}
if(Sell == 1)
{
sig = "SELL";
entry = C;
sl = TrendSL;
tar1 = entry - (entry * .0050);
tar2 = entry - (entry * .0112);
tar3 = entry - (entry * .0212);
bars = i;
i = 0;
}
}
Offset = 20;
Clr = IIf(sig == "BUY", colorLime, colorRed);
ssl = IIf(bars == BarCount-1, TrendSL[BarCount-1], Ref(TrendSL, -1));
sl = ssl[BarCount-1];
Plot(LineArray(bars-Offset, tar1, BarCount, tar1,1), "", Clr, styleLine|styleDots, Null, Null, Offset);
Plot(LineArray(bars-Offset, tar2, BarCount, tar2,1), "", Clr, styleLine|styleDots, Null, Null, Offset);
Plot(LineArray(bars-Offset, tar3, BarCount, tar3,1), "", Clr, styleLine|styleDots, Null, Null, Offset);
//Plot(LineArray(bars-Offset, sl, BarCount, sl,1), "", colorDarkRed, styleLine|styleLine, Null, Null, Offset);
//Plot(LineArray(bars-Offset, entry, BarCount, entry,1), "", colorGreen, styleLine|styleLine, Null, Null, Offset);
/*for (i=bars; i <BarCount;i++)
{
PlotText(""+sig+"@"+entry, BarCount-5,entry,Null,colorBlue);
PlotText("T1@"+tar1,BarCount-5,tar1,Null,Clr);PlotText("T2@"+tar2,BarCount-5,tar2,Null,Clr);PlotText ("T3@"+tar3,BarCount-5,tar3,Null,Clr);
}*/
messageboard = ParamToggle("Message Board","Show|Hide",1);
if (messageboard == 1 )
{
GfxSelectFont( "Tahoma", 13, 100 );
GfxSetBkMode( 1 );
GfxSetTextColor( colorWhite );
if ( sig =="BUY")
{
GfxSelectSolidBrush( colorBlue ); // this is the box background color
}
else
{
GfxSelectSolidBrush( colorRed ); // this is the box background color
}
pxHeight = Status( "pxchartheight" ) ;
xx = Status( "pxchartwidth");
Left = 1100;
width = 310;
x = 5;
x2 = 290;
y = pxHeight;
GfxSelectPen( colorGreen, 1); // broader color
GfxRoundRect( x, y - 98, x2, y , 7, 7 ) ;
GfxTextOut( ( "My Magic"),13,y-100);
GfxTextOut( (" "),27,y-100);
GfxTextOut( ("Last " + sig + " Signal came " + (BarCount-bars-1) * Interval()/60 + " mins ago"), 13, y-80) ; // The text format location
GfxTextOut( ("" + WriteIf(sig =="BUY",sig + " @ ",sig + " @") + " : " + entry), 13, y-60);
GfxTextOut( ("Trailing SL : " + Ref(TrendSL,-1) + " (" + WriteVal(IIf(sig == "SELL",entry-sl,sl-entry), 2.2) + ")"), 13, y-40);
/*GfxTextOut( ("TGT:1 : " + tar1), 13, y -80);
GfxTextOut( ("TGT:2 : " + tar2), 13,y-60);
GfxTextOut( ("TGT:3 : " + tar3), 13,y-40);*/
GfxTextOut( ("Current P/L : " + WriteVal(IIf(sig == "BUY",(C-entry),(entry-C)),2.2)), 13, y-22);;
//Magfied Market Price
FS=Param("Font Size",30,11,100,1);
GfxSelectFont("Times New Roman", FS, 700, True );
GfxSetBkMode( colorWhite );
GfxSetTextColor( ParamColor("Color",colorGreen) );
Hor=Param("Horizontal Position",940,1,1200,1);
Ver=Param("Vertical Position",12,1,830,1);
GfxTextOut(""+C, Hor , Ver );
YC=TimeFrameGetPrice("C",inDaily,-1);
DD=Prec(C-YC,2);
xx=Prec((DD/YC)*100,2);
GfxSelectFont("Times New Roman", 11, 700, True );
GfxSetBkMode( colorBlack );
GfxSetTextColor(ParamColor("Color",colorYellow) );
GfxTextOut(""+DD+" ("+xx+"%)", Hor , Ver+45 );
}
_SECTION_END();
_SECTION_BEGIN("Time Left");
function GetSecondNum()
{
Time = Now( 4 );
Seconds = int( Time % 100 );
Minutes = int( Time / 100 % 100 );
Hours = int( Time / 10000 % 100 );
SecondNum = int( Hours * 60 * 60 + Minutes * 60 + Seconds );
return SecondNum;
}
RequestTimedRefresh( 1 );
TimeFrame = Interval();
SecNumber = GetSecondNum();
Newperiod = SecNumber % TimeFrame == 0;
SecsLeft = SecNumber - int( SecNumber / TimeFrame ) * TimeFrame;
SecsToGo = TimeFrame - SecsLeft;
x=Param("xposn",50,0,1000,1);
y=Param("yposn",380,0,1000,1);
GfxSelectSolidBrush( ColorRGB( 230, 230, 230 ) );
GfxSelectPen( ColorRGB( 230, 230, 230 ), 2 );
if ( NewPeriod )
{
GfxSelectSolidBrush( colorYellow );
GfxSelectPen( colorYellow, 2 );
Say( "New period" );
}
//GfxRoundRect( x+45, y+40, x-3, y-2, 0, 0 );
//GfxSetBkMode(1);
GfxSelectFont( "Arial", 14, 700, False );
GfxSetTextColor( colorRed );
GfxTextOut( "Time Left :"+SecsToGo+"", x, y );
_SECTION_END();
////////////////// PARABOLIC SAR///////////////
_SECTION_BEGIN("PARABOLIC SAR");
/////////////////////////////////
IAF = 0.02; // acceleration factor
MaxAF = 0.2; // max acceleration
psar = Close; // initialize
long = 1; // assume long for initial conditions
af = IAF; // init acelleration factor
ep = Low[ 0 ]; // init extreme point
hp = High [ 0 ];
lp = Low [ 0 ];
for( i = 2; i < BarCount; i++ )
{
if ( long )
{
psar [ i ] = psar [ i-1 ] + af * ( hp - psar [ i-1 ] );
}
else
{
psar [ i ] = psar [ i-1 ] + af * ( lp - psar [ i-1 ] );
}
reverse = 0;
//check for reversal
if ( long )
{
if ( Low [ i ] < psar [ i ] )
{
long = 0; reverse = 1; // reverse position to Short
psar [ i ] = hp; // SAR is High point in prev trade
lp = Low [ i ];
af = IAF;
}
}
else
{
if ( High [ i ] > psar [ i ] )
{
long = 1; reverse = 1; //reverse position to long
psar [ i ] = lp;
hp = High [ i ];
af = IAF;
}
}
if ( reverse == 0 )
{
if ( long )
{
if ( High [ i ] > hp )
{
hp = High [ i ];
af = af + IAF;
if( af > MaxAF ) af = MaxAF;
}
if( Low[ i - 1 ] < psar[ i ] ) psar[ i ] = Low[ i - 1 ];
if( Low[ i - 2 ] < psar[ i ] ) psar[ i ] = Low[ i - 2 ];
}
else
{
if ( Low [ i ] < lp )
{
lp = Low [ i ];
af = af + IAF;
if( af > MaxAF ) af = MaxAF;
}
if( High[ i - 1 ] > psar[ i ] ) psar[ i ] = High[ i - 1 ];
if( High[ i - 2 ] > psar[ i ] ) psar[ i ] = High[ i - 2 ];
}
}
}
//Plot( Close, "Price", colorBlack, styleCandle );
Plot( psar, "SAR", colorRed, styleDots | styleNoLine | styleThick );
range = 15;//Param("Periods", 14, 2, 200, 1 );
ADXi=ADX(range);
PDIi=PDI(range);
MDIi=MDI(range);
//Plot( ADXi=ADX(range), _DEFAULT_NAME(), ParamColor( "ADX color", colorBlue ), ParamStyle("ADX style", styleThick ) );
//Plot( PDIi=PDI(range), "", ParamColor( "+DI color", colorGreen ), ParamStyle("+DI style") );
//Plot( MDIi=MDI(range), "", ParamColor( "-DI color", colorRed ), ParamStyle("-DI style") );
uptrend=PDIi>MDIi;//+di greater than -di
downtrend=MDIi>PDIi;//-di greater than +di
Ribboncol=IIf(upTrend,colorGreen, IIf(downtrend,colorRed, colorBlack));
Plot(6, "", Ribboncol, styleOwnScale|styleArea|styleNoLabel, -7.5,100);
Buy=Cross(L,psar) AND uptrend;
Sell=Cross(psar,H) AND downtrend;
//PlotShapes(Sell*shapeDownArrow,colorRed);
//PlotShapes(Buy*shapeUpArrow,colorGreen);
_SECTION_END();
_SECTION_BEGIN("Kill The Operator MACD");
SetChartBkColor(ParamColor("Panel color ",colorBlack));
r1 = Param( "Fast avg", 12, 2, 200, 1 );
r2 = Param( "Slow avg", 26, 2, 200, 1 );
r3 = Param( "Signal avg", 9, 2, 200, 1 );
Plot( ml = MACD(r1, r2), StrFormat(_SECTION_NAME()+"(%g,%g)", r1, r2), ParamColor("MACD color", colorRed ), ParamStyle("MACD style") );
Plot( sl = Signal(r1,r2,r3), "Signal" + _PARAM_VALUES(), ParamColor("Signal color", colorBlue ), ParamStyle("Signal style") );
Histogram_color = IIf( ml-sl > 0, colorBlue, colorRed);
Plot( ml-sl, "MACD Histogram", Histogram_color, styleNoTitle | ParamStyle("Histogram style", styleHistogram | styleThick | styleNoLabel, maskHistogram ) );
Title = EncodeColor(colorWhite)+ "Kill The Operator MACD";
_SECTION_END();
x = ml;
y = sl;
Buy=Cross(x,y);
PlotShapes(shapeUpArrow*Buy,colorBlue);
Sell=Cross(y,x);
PlotShapes(shapeDownArrow*Sell,colorYellow);
AlertIf( Buy, "SOUND C:\\Windows\\Media\\notify.wav", "Audio alert", 2 );
AlertIf( Sell, "SOUND C:\\Windows\\Media\\chord.wav", "Audio alert", 2 );
/* Trend Filters */
TimeFrameSet(in15Minute);
SwingTrd151 = 100 * (Close - ((MA(C,2)+
MA(MA(C,2),2)+
MA(MA(MA(C,2),2),2) +
MA(MA(MA(MA(C,2),2),2),2) +
MA(MA(MA(MA(MA(C,2),2),2),2),2) +
MA(MA(MA(MA(MA(MA(C,2),2),2),2),2),2) +
MA(MA(MA(MA(MA(MA(MA(C,2),2),2),2),2),2),2)+
MA(MA(MA(MA(MA(MA(MA(MA(C,2),2),2),2),2),2),2),2)+
MA(MA(MA(MA(MA(MA(MA(MA(MA(C,2),2),2),2),2),2),2), 2),2)+
MA(MA(MA(MA(MA(MA(MA(MA(MA(MA(C,2),2),2),2),2),2), 2),2),2),2))
/10))/(HHV(C,10)-LLV(C,10));
SwingTrd152=EMA(SwingTrd151,13);
SwingTrd153=EMA(SwingTrd152,13);
RMO15= EMA(SwingTrd151,34);
Bull_Trend15=EMA(SwingTrd151,34)>0;
Bear_Trend15=EMA(SwingTrd151,34)<0;
TimeFrameRestore();
Ribbon_kol15=IIf(TimeFrameExpand(Bull_Trend15,in15Minute),colorBlue, IIf(TimeFrameExpand(Bear_Trend15,in15Minute),colorRed, colorBlack));
Plot(2, "ribbon", Ribbon_kol15, styleOwnScale|styleArea|styleNoLabel, -0.5,100);
TimeFrameSet(10*in1Minute);
SwingTrd101 = 100 * (Close - ((MA(C,2)+
MA(MA(C,2),2)+
MA(MA(MA(C,2),2),2) +
MA(MA(MA(MA(C,2),2),2),2) +
MA(MA(MA(MA(MA(C,2),2),2),2),2) +
MA(MA(MA(MA(MA(MA(C,2),2),2),2),2),2) +
MA(MA(MA(MA(MA(MA(MA(C,2),2),2),2),2),2),2)+
MA(MA(MA(MA(MA(MA(MA(MA(C,2),2),2),2),2),2),2),2)+
MA(MA(MA(MA(MA(MA(MA(MA(MA(C,2),2),2),2),2),2),2), 2),2)+
MA(MA(MA(MA(MA(MA(MA(MA(MA(MA(C,2),2),2),2),2),2), 2),2),2),2))
/10))/(HHV(C,10)-LLV(C,10));
SwingTrd102=
EMA(SwingTrd101,13);
SwingTrd103=EMA(SwingTrd102,13);
RMO10= EMA(SwingTrd101,34);
Bull_Trend10=EMA(SwingTrd101,34)>0;
Bear_Trend10=EMA(SwingTrd101,34)<0;
TimeFrameRestore();
Ribbon_kol10=IIf(TimeFrameExpand(Bull_Trend10,10*in1Minute),colorBlue, IIf(TimeFrameExpand(Bear_Trend10,10*in1Minute),colorRed, colorBlack));
Plot(4, "ribbon", Ribbon_kol10, styleOwnScale|styleArea|styleNoLabel, -0.5,100);
SwingTrd1 = 100 * (Close - ((MA(C,2)+
MA(MA(C,2),2)+
MA(MA(MA(C,2),2),2) +
MA(MA(MA(MA(C,2),2),2),2) +
MA(MA(MA(MA(MA(C,2),2),2),2),2) +
MA(MA(MA(MA(MA(MA(C,2),2),2),2),2),2) +
MA(MA(MA(MA(MA(MA(MA(C,2),2),2),2),2),2),2)+
MA(MA(MA(MA(MA(MA(MA(MA(C,2),2),2),2),2),2),2),2)+
MA(MA(MA(MA(MA(MA(MA(MA(MA(C,2),2),2),2),2),2),2), 2),2)+
MA(MA(MA(MA(MA(MA(MA(MA(MA(MA(C,2),2),2),2),2),2), 2),2),2),2))
/10))/(HHV(C,10)-LLV(C,10));
SwingTrd2=
EMA(SwingTrd1,13);
SwingTrd3=
EMA(SwingTrd2,13);
RMO= EMA(SwingTrd1,34);
Bull_Trend=EMA(SwingTrd1,34)>0;
Bear_Trend=EMA(SwingTrd1,34)<0;
Ribbon_kol=IIf(Bull_Trend,colorBlue, IIf(Bear_Trend,colorRed, colorBlack));
Plot(6, "ribbon", Ribbon_kol, styleOwnScale|styleArea|styleNoLabel, -0.5,100);
// End of Trend Filters
These are TWO AFL
Test This AFL for 30 Minutes Timeframe. WHen both give Buy or Sell Simultaneously then only enter in trade
If ribbon is red then ignore buy calls
If ribbon is green then ignore sell calls
put up your results for others
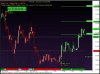
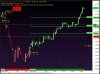
I dont use Amibroker so would love to see Charts with the AFL's applied on them.
Request Sushil to do it as I assume he must be having this AFL in his AMi !")
Request Sushil to do it as I assume he must be having this AFL in his AMi !
_SECTION_BEGIN("MyMagic");
SetBarsRequired(100000,0);
GraphXSpace = 15;
SetChartOptions(0,chartShowArrows|chartShowDates);
SetChartBkColor(ParamColor("bkcolor",ColorRGB(0,0, 0)));
GfxSetBkMode(0);
GfxSetOverlayMode(1);
SetBarFillColor(IIf(C>O,ParamColor("Candle UP Color", colorGreen),IIf(C<=O,ParamColor("Candle Down Color", colorRed),colorLightGrey)));
//Plot(C,"\nPrice",IIf(C>O,ParamColor("Wick UP Color", colorDarkGreen),IIf(C<=O,ParamColor("Wick Down Color", colorDarkRed),colorLightGrey)),64,0,0,0,0);
SetTradeDelays(1,1,1,1);
HaClose = (O + H + L + C)/4;
HaOpen = AMA( Ref( HaClose, -1 ), 0.5 );
HaHigh = Max( H, Max( HaClose, HaOpen ) );
HaLow = Min( L, Min( HaClose, HaOpen ) );
xDiff = (HaHigh - Halow) * 10000;
barcolor = IIf(HaClose >= HaOpen,colorGreen,colorRed);
PlotOHLC( HaOpen, HaHigh, HaLow, HaClose, "", barcolor, styleCandle );
_N(Title = StrFormat("{{NAME}} - {{INTERVAL}} {{DATE}} Open %g, Hi %g, Lo %g, Close %g (%.1f%%) {{VALUES}}", O, H, L, C, SelectedValue( ROC( C, 1 ) ) ));
Factor=Param("Factor",2,1,10,0.1);
Pd=Param("ATR Periods",11,1,100,1);
Up=(H+L)/2+(Factor*ATR(Pd));
Dn=(H+L)/2-(Factor*ATR(Pd));
iATR=ATR(Pd);
TrendUp=TrendDown=Null;
trend[0]=1;
changeOfTrend=0;
flag=flagh=0;
for (i = 1; i <BarCount-1; i++) {
TrendUp = Null;
TrendDown = Null;
trend=1;
if (Close>Up[i-1]) {
trend=1;
if (trend[i-1] == -1) changeOfTrend = 1;
}
else if (Close<Dn[i-1]) {
trend=-1;
if (trend[i-1] == 1) changeOfTrend = 1;
}
else if (trend[i-1]==1) {
trend=1;
changeOfTrend = 0;
}
else if (trend[i-1]==-1) {
trend=-1;
changeOfTrend = 0;
}
if (trend<0 && trend[i-1]>0) {
flag=1;
}
else {
flag=0;
}
if (trend>0 && trend[i-1]<0) {
flagh=1;
}
else {
flagh=0;
}
if (trend>0 && Dn<Dn[i-1]){
Dn=Dn[i-1];
}
if (trend<0 && Up>Up[i-1])
{ Up=Up[i-1];
}
if (flag==1)
{ Up=(H+L)/2+(Factor*iATR);;
}
if (flagh==1)
{ Dn=(H+L)/2-(Factor*iATR);;
}
if (trend==1) {
TrendUp=Dn;
if (changeOfTrend == 1) {
TrendUp[i-1] = TrendDown[i-1];
changeOfTrend = 0;
}
}
else if (trend==-1) {
TrendDown=Up;
if (changeOfTrend == 1) {
TrendDown[i-1] = TrendUp[i-1];
changeOfTrend = 0;
}
}
}
Plot(TrendUp,"Trend",colorGreen);
Plot(TrendDown,"Down",colorRed);
Buy = trend==1;
Sell=trend==-1;
Buy=ExRem(Buy,Sell);
Sell=ExRem(Sell,Buy);
Short=Sell;
Cover=Buy;
BuyPrice=ValueWhen(Buy,C);
SellPrice=ValueWhen(Sell,C);
ShortPrice=ValueWhen(Short,C);
CoverPrice=ValueWhen(Cover,C);
Title = EncodeColor(colorWhite)+ "My Magic AFL" + " - " + Name() + " - " + EncodeColor(colorRed)+ Interval(2) + EncodeColor(colorWhite) +
" - " + Date() +" - "+"\n" +EncodeColor(colorRed) +"Op-"+O+" "+"Hi-"+H+" "+"Lo-"+L+" "+
"Cl-"+C+" "+ "Vol= "+ WriteVal(V)+"\n"+
EncodeColor(colorLime)+
WriteIf (Buy , " GO LONG / Reverse Signal at "+C+" ","")+
WriteIf (Sell , " EXIT LONG / Reverse Signal at "+C+" ","")+"\n"+EncodeColor(colorYellow)+
WriteIf(Sell , "Total Profit/Loss for the Last Trade Rs."+(C-BuyPrice)+"","")+
WriteIf(Buy , "Total Profit/Loss for the Last trade Rs."+(SellPrice-C)+"","");
PlotShapes(IIf(Buy, shapeSquare, shapeNone),colorGreen, 0, L, Offset=-40);
PlotShapes(IIf(Buy, shapeSquare, shapeNone),colorLime, 0,L, Offset=-50);
PlotShapes(IIf(Buy, shapeUpArrow, shapeNone),colorWhite, 0,L, Offset=-45);
PlotShapes(IIf(Short, shapeSquare, shapeNone),colorRed, 0, H, Offset=40);
PlotShapes(IIf(Short, shapeSquare, shapeNone),colorOrange, 0,H, Offset=50);
PlotShapes(IIf(Short, shapeDownArrow, shapeNone),colorWhite, 0,H, Offset=-45);
TrendSL=IIf(trend==1,TrendUp,TrendDown);
for(i=BarCount-1;i>1;i--)
{
if(Buy == 1)
{
entry = C;
sig = "BUY";
sl = TrendSL;
tar1 = entry + (entry * .0050);
tar2 = entry + (entry * .0092);
tar3 = entry + (entry * .0179);
bars = i;
i = 0;
}
if(Sell == 1)
{
sig = "SELL";
entry = C;
sl = TrendSL;
tar1 = entry - (entry * .0050);
tar2 = entry - (entry * .0112);
tar3 = entry - (entry * .0212);
bars = i;
i = 0;
}
}
Offset = 20;
Clr = IIf(sig == "BUY", colorLime, colorRed);
ssl = IIf(bars == BarCount-1, TrendSL[BarCount-1], Ref(TrendSL, -1));
sl = ssl[BarCount-1];
Plot(LineArray(bars-Offset, tar1, BarCount, tar1,1), "", Clr, styleLine|styleDots, Null, Null, Offset);
Plot(LineArray(bars-Offset, tar2, BarCount, tar2,1), "", Clr, styleLine|styleDots, Null, Null, Offset);
Plot(LineArray(bars-Offset, tar3, BarCount, tar3,1), "", Clr, styleLine|styleDots, Null, Null, Offset);
//Plot(LineArray(bars-Offset, sl, BarCount, sl,1), "", colorDarkRed, styleLine|styleLine, Null, Null, Offset);
//Plot(LineArray(bars-Offset, entry, BarCount, entry,1), "", colorGreen, styleLine|styleLine, Null, Null, Offset);
/*for (i=bars; i <BarCount;i++)
{
PlotText(""+sig+"@"+entry, BarCount-5,entry,Null,colorBlue);
PlotText("T1@"+tar1,BarCount-5,tar1,Null,Clr);PlotText("T2@"+tar2,BarCount-5,tar2,Null,Clr);PlotText ("T3@"+tar3,BarCount-5,tar3,Null,Clr);
}*/
messageboard = ParamToggle("Message Board","Show|Hide",1);
if (messageboard == 1 )
{
GfxSelectFont( "Tahoma", 13, 100 );
GfxSetBkMode( 1 );
GfxSetTextColor( colorWhite );
if ( sig =="BUY")
{
GfxSelectSolidBrush( colorBlue ); // this is the box background color
}
else
{
GfxSelectSolidBrush( colorRed ); // this is the box background color
}
pxHeight = Status( "pxchartheight" ) ;
xx = Status( "pxchartwidth");
Left = 1100;
width = 310;
x = 5;
x2 = 290;
y = pxHeight;
GfxSelectPen( colorGreen, 1); // broader color
GfxRoundRect( x, y - 98, x2, y , 7, 7 ) ;
GfxTextOut( ( "My Magic"),13,y-100);
GfxTextOut( (" "),27,y-100);
GfxTextOut( ("Last " + sig + " Signal came " + (BarCount-bars-1) * Interval()/60 + " mins ago"), 13, y-80) ; // The text format location
GfxTextOut( ("" + WriteIf(sig =="BUY",sig + " @ ",sig + " @") + " : " + entry), 13, y-60);
GfxTextOut( ("Trailing SL : " + Ref(TrendSL,-1) + " (" + WriteVal(IIf(sig == "SELL",entry-sl,sl-entry), 2.2) + ")"), 13, y-40);
/*GfxTextOut( ("TGT:1 : " + tar1), 13, y -80);
GfxTextOut( ("TGT:2 : " + tar2), 13,y-60);
GfxTextOut( ("TGT:3 : " + tar3), 13,y-40);*/
GfxTextOut( ("Current P/L : " + WriteVal(IIf(sig == "BUY",(C-entry),(entry-C)),2.2)), 13, y-22);;
//Magfied Market Price
FS=Param("Font Size",30,11,100,1);
GfxSelectFont("Times New Roman", FS, 700, True );
GfxSetBkMode( colorWhite );
GfxSetTextColor( ParamColor("Color",colorGreen) );
Hor=Param("Horizontal Position",940,1,1200,1);
Ver=Param("Vertical Position",12,1,830,1);
GfxTextOut(""+C, Hor , Ver );
YC=TimeFrameGetPrice("C",inDaily,-1);
DD=Prec(C-YC,2);
xx=Prec((DD/YC)*100,2);
GfxSelectFont("Times New Roman", 11, 700, True );
GfxSetBkMode( colorBlack );
GfxSetTextColor(ParamColor("Color",colorYellow) );
GfxTextOut(""+DD+" ("+xx+"%)", Hor , Ver+45 );
}
_SECTION_END();
_SECTION_BEGIN("Time Left");
function GetSecondNum()
{
Time = Now( 4 );
Seconds = int( Time % 100 );
Minutes = int( Time / 100 % 100 );
Hours = int( Time / 10000 % 100 );
SecondNum = int( Hours * 60 * 60 + Minutes * 60 + Seconds );
return SecondNum;
}
RequestTimedRefresh( 1 );
TimeFrame = Interval();
SecNumber = GetSecondNum();
Newperiod = SecNumber % TimeFrame == 0;
SecsLeft = SecNumber - int( SecNumber / TimeFrame ) * TimeFrame;
SecsToGo = TimeFrame - SecsLeft;
x=Param("xposn",50,0,1000,1);
y=Param("yposn",380,0,1000,1);
GfxSelectSolidBrush( ColorRGB( 230, 230, 230 ) );
GfxSelectPen( ColorRGB( 230, 230, 230 ), 2 );
if ( NewPeriod )
{
GfxSelectSolidBrush( colorYellow );
GfxSelectPen( colorYellow, 2 );
Say( "New period" );
}
//GfxRoundRect( x+45, y+40, x-3, y-2, 0, 0 );
//GfxSetBkMode(1);
GfxSelectFont( "Arial", 14, 700, False );
GfxSetTextColor( colorRed );
GfxTextOut( "Time Left :"+SecsToGo+"", x, y );
_SECTION_END();
////////////////// PARABOLIC SAR///////////////
_SECTION_BEGIN("PARABOLIC SAR");
/////////////////////////////////
IAF = 0.02; // acceleration factor
MaxAF = 0.2; // max acceleration
psar = Close; // initialize
long = 1; // assume long for initial conditions
af = IAF; // init acelleration factor
ep = Low[ 0 ]; // init extreme point
hp = High [ 0 ];
lp = Low [ 0 ];
for( i = 2; i < BarCount; i++ )
{
if ( long )
{
psar [ i ] = psar [ i-1 ] + af * ( hp - psar [ i-1 ] );
}
else
{
psar [ i ] = psar [ i-1 ] + af * ( lp - psar [ i-1 ] );
}
reverse = 0;
//check for reversal
if ( long )
{
if ( Low [ i ] < psar [ i ] )
{
long = 0; reverse = 1; // reverse position to Short
psar [ i ] = hp; // SAR is High point in prev trade
lp = Low [ i ];
af = IAF;
}
}
else
{
if ( High [ i ] > psar [ i ] )
{
long = 1; reverse = 1; //reverse position to long
psar [ i ] = lp;
hp = High [ i ];
af = IAF;
}
}
if ( reverse == 0 )
{
if ( long )
{
if ( High [ i ] > hp )
{
hp = High [ i ];
af = af + IAF;
if( af > MaxAF ) af = MaxAF;
}
if( Low[ i - 1 ] < psar[ i ] ) psar[ i ] = Low[ i - 1 ];
if( Low[ i - 2 ] < psar[ i ] ) psar[ i ] = Low[ i - 2 ];
}
else
{
if ( Low [ i ] < lp )
{
lp = Low [ i ];
af = af + IAF;
if( af > MaxAF ) af = MaxAF;
}
if( High[ i - 1 ] > psar[ i ] ) psar[ i ] = High[ i - 1 ];
if( High[ i - 2 ] > psar[ i ] ) psar[ i ] = High[ i - 2 ];
}
}
}
//Plot( Close, "Price", colorBlack, styleCandle );
Plot( psar, "SAR", colorRed, styleDots | styleNoLine | styleThick );
range = 15;//Param("Periods", 14, 2, 200, 1 );
ADXi=ADX(range);
PDIi=PDI(range);
MDIi=MDI(range);
//Plot( ADXi=ADX(range), _DEFAULT_NAME(), ParamColor( "ADX color", colorBlue ), ParamStyle("ADX style", styleThick ) );
//Plot( PDIi=PDI(range), "", ParamColor( "+DI color", colorGreen ), ParamStyle("+DI style") );
//Plot( MDIi=MDI(range), "", ParamColor( "-DI color", colorRed ), ParamStyle("-DI style") );
uptrend=PDIi>MDIi;//+di greater than -di
downtrend=MDIi>PDIi;//-di greater than +di
Ribboncol=IIf(upTrend,colorGreen, IIf(downtrend,colorRed, colorBlack));
Plot(6, "", Ribboncol, styleOwnScale|styleArea|styleNoLabel, -7.5,100);
Buy=Cross(L,psar) AND uptrend;
Sell=Cross(psar,H) AND downtrend;
//PlotShapes(Sell*shapeDownArrow,colorRed);
//PlotShapes(Buy*shapeUpArrow,colorGreen);
_SECTION_END();
_SECTION_BEGIN("Kill The Operator MACD");
SetChartBkColor(ParamColor("Panel color ",colorBlack));
r1 = Param( "Fast avg", 12, 2, 200, 1 );
r2 = Param( "Slow avg", 26, 2, 200, 1 );
r3 = Param( "Signal avg", 9, 2, 200, 1 );
Plot( ml = MACD(r1, r2), StrFormat(_SECTION_NAME()+"(%g,%g)", r1, r2), ParamColor("MACD color", colorRed ), ParamStyle("MACD style") );
Plot( sl = Signal(r1,r2,r3), "Signal" + _PARAM_VALUES(), ParamColor("Signal color", colorBlue ), ParamStyle("Signal style") );
Histogram_color = IIf( ml-sl > 0, colorBlue, colorRed);
Plot( ml-sl, "MACD Histogram", Histogram_color, styleNoTitle | ParamStyle("Histogram style", styleHistogram | styleThick | styleNoLabel, maskHistogram ) );
Title = EncodeColor(colorWhite)+ "Kill The Operator MACD";
_SECTION_END();
x = ml;
y = sl;
Buy=Cross(x,y);
PlotShapes(shapeUpArrow*Buy,colorBlue);
Sell=Cross(y,x);
PlotShapes(shapeDownArrow*Sell,colorYellow);
AlertIf( Buy, "SOUND C:\\Windows\\Media\\notify.wav", "Audio alert", 2 );
AlertIf( Sell, "SOUND C:\\Windows\\Media\\chord.wav", "Audio alert", 2 );
/* Trend Filters */
TimeFrameSet(in15Minute);
SwingTrd151 = 100 * (Close - ((MA(C,2)+
MA(MA(C,2),2)+
MA(MA(MA(C,2),2),2) +
MA(MA(MA(MA(C,2),2),2),2) +
MA(MA(MA(MA(MA(C,2),2),2),2),2) +
MA(MA(MA(MA(MA(MA(C,2),2),2),2),2),2) +
MA(MA(MA(MA(MA(MA(MA(C,2),2),2),2),2),2),2)+
MA(MA(MA(MA(MA(MA(MA(MA(C,2),2),2),2),2),2),2),2)+
MA(MA(MA(MA(MA(MA(MA(MA(MA(C,2),2),2),2),2),2),2), 2),2)+
MA(MA(MA(MA(MA(MA(MA(MA(MA(MA(C,2),2),2),2),2),2), 2),2),2),2))
/10))/(HHV(C,10)-LLV(C,10));
SwingTrd152=EMA(SwingTrd151,13);
SwingTrd153=EMA(SwingTrd152,13);
RMO15= EMA(SwingTrd151,34);
Bull_Trend15=EMA(SwingTrd151,34)>0;
Bear_Trend15=EMA(SwingTrd151,34)<0;
TimeFrameRestore();
Ribbon_kol15=IIf(TimeFrameExpand(Bull_Trend15,in15Minute),colorBlue, IIf(TimeFrameExpand(Bear_Trend15,in15Minute),colorRed, colorBlack));
Plot(2, "ribbon", Ribbon_kol15, styleOwnScale|styleArea|styleNoLabel, -0.5,100);
TimeFrameSet(10*in1Minute);
SwingTrd101 = 100 * (Close - ((MA(C,2)+
MA(MA(C,2),2)+
MA(MA(MA(C,2),2),2) +
MA(MA(MA(MA(C,2),2),2),2) +
MA(MA(MA(MA(MA(C,2),2),2),2),2) +
MA(MA(MA(MA(MA(MA(C,2),2),2),2),2),2) +
MA(MA(MA(MA(MA(MA(MA(C,2),2),2),2),2),2),2)+
MA(MA(MA(MA(MA(MA(MA(MA(C,2),2),2),2),2),2),2),2)+
MA(MA(MA(MA(MA(MA(MA(MA(MA(C,2),2),2),2),2),2),2), 2),2)+
MA(MA(MA(MA(MA(MA(MA(MA(MA(MA(C,2),2),2),2),2),2), 2),2),2),2))
/10))/(HHV(C,10)-LLV(C,10));
SwingTrd102=
EMA(SwingTrd101,13);
SwingTrd103=EMA(SwingTrd102,13);
RMO10= EMA(SwingTrd101,34);
Bull_Trend10=EMA(SwingTrd101,34)>0;
Bear_Trend10=EMA(SwingTrd101,34)<0;
TimeFrameRestore();
Ribbon_kol10=IIf(TimeFrameExpand(Bull_Trend10,10*in1Minute),colorBlue, IIf(TimeFrameExpand(Bear_Trend10,10*in1Minute),colorRed, colorBlack));
Plot(4, "ribbon", Ribbon_kol10, styleOwnScale|styleArea|styleNoLabel, -0.5,100);
SwingTrd1 = 100 * (Close - ((MA(C,2)+
MA(MA(C,2),2)+
MA(MA(MA(C,2),2),2) +
MA(MA(MA(MA(C,2),2),2),2) +
MA(MA(MA(MA(MA(C,2),2),2),2),2) +
MA(MA(MA(MA(MA(MA(C,2),2),2),2),2),2) +
MA(MA(MA(MA(MA(MA(MA(C,2),2),2),2),2),2),2)+
MA(MA(MA(MA(MA(MA(MA(MA(C,2),2),2),2),2),2),2),2)+
MA(MA(MA(MA(MA(MA(MA(MA(MA(C,2),2),2),2),2),2),2), 2),2)+
MA(MA(MA(MA(MA(MA(MA(MA(MA(MA(C,2),2),2),2),2),2), 2),2),2),2))
/10))/(HHV(C,10)-LLV(C,10));
SwingTrd2=
EMA(SwingTrd1,13);
SwingTrd3=
EMA(SwingTrd2,13);
RMO= EMA(SwingTrd1,34);
Bull_Trend=EMA(SwingTrd1,34)>0;
Bear_Trend=EMA(SwingTrd1,34)<0;
Ribbon_kol=IIf(Bull_Trend,colorBlue, IIf(Bear_Trend,colorRed, colorBlack));
Plot(6, "ribbon", Ribbon_kol, styleOwnScale|styleArea|styleNoLabel, -0.5,100);
// End of Trend Filters
These are TWO AFL
Test This AFL for 30 Minutes Timeframe. WHen both give Buy or Sell Simultaneously then only enter in trade
If ribbon is red then ignore buy calls
If ribbon is green then ignore sell calls
put up your results for others
SetBarsRequired(100000,0);
GraphXSpace = 15;
SetChartOptions(0,chartShowArrows|chartShowDates);
SetChartBkColor(ParamColor("bkcolor",ColorRGB(0,0, 0)));
GfxSetBkMode(0);
GfxSetOverlayMode(1);
SetBarFillColor(IIf(C>O,ParamColor("Candle UP Color", colorGreen),IIf(C<=O,ParamColor("Candle Down Color", colorRed),colorLightGrey)));
//Plot(C,"\nPrice",IIf(C>O,ParamColor("Wick UP Color", colorDarkGreen),IIf(C<=O,ParamColor("Wick Down Color", colorDarkRed),colorLightGrey)),64,0,0,0,0);
SetTradeDelays(1,1,1,1);
HaClose = (O + H + L + C)/4;
HaOpen = AMA( Ref( HaClose, -1 ), 0.5 );
HaHigh = Max( H, Max( HaClose, HaOpen ) );
HaLow = Min( L, Min( HaClose, HaOpen ) );
xDiff = (HaHigh - Halow) * 10000;
barcolor = IIf(HaClose >= HaOpen,colorGreen,colorRed);
PlotOHLC( HaOpen, HaHigh, HaLow, HaClose, "", barcolor, styleCandle );
_N(Title = StrFormat("{{NAME}} - {{INTERVAL}} {{DATE}} Open %g, Hi %g, Lo %g, Close %g (%.1f%%) {{VALUES}}", O, H, L, C, SelectedValue( ROC( C, 1 ) ) ));
Factor=Param("Factor",2,1,10,0.1);
Pd=Param("ATR Periods",11,1,100,1);
Up=(H+L)/2+(Factor*ATR(Pd));
Dn=(H+L)/2-(Factor*ATR(Pd));
iATR=ATR(Pd);
TrendUp=TrendDown=Null;
trend[0]=1;
changeOfTrend=0;
flag=flagh=0;
for (i = 1; i <BarCount-1; i++) {
TrendUp = Null;
TrendDown = Null;
trend=1;
if (Close>Up[i-1]) {
trend=1;
if (trend[i-1] == -1) changeOfTrend = 1;
}
else if (Close<Dn[i-1]) {
trend=-1;
if (trend[i-1] == 1) changeOfTrend = 1;
}
else if (trend[i-1]==1) {
trend=1;
changeOfTrend = 0;
}
else if (trend[i-1]==-1) {
trend=-1;
changeOfTrend = 0;
}
if (trend<0 && trend[i-1]>0) {
flag=1;
}
else {
flag=0;
}
if (trend>0 && trend[i-1]<0) {
flagh=1;
}
else {
flagh=0;
}
if (trend>0 && Dn<Dn[i-1]){
Dn=Dn[i-1];
}
if (trend<0 && Up>Up[i-1])
{ Up=Up[i-1];
}
if (flag==1)
{ Up=(H+L)/2+(Factor*iATR);;
}
if (flagh==1)
{ Dn=(H+L)/2-(Factor*iATR);;
}
if (trend==1) {
TrendUp=Dn;
if (changeOfTrend == 1) {
TrendUp[i-1] = TrendDown[i-1];
changeOfTrend = 0;
}
}
else if (trend==-1) {
TrendDown=Up;
if (changeOfTrend == 1) {
TrendDown[i-1] = TrendUp[i-1];
changeOfTrend = 0;
}
}
}
Plot(TrendUp,"Trend",colorGreen);
Plot(TrendDown,"Down",colorRed);
Buy = trend==1;
Sell=trend==-1;
Buy=ExRem(Buy,Sell);
Sell=ExRem(Sell,Buy);
Short=Sell;
Cover=Buy;
BuyPrice=ValueWhen(Buy,C);
SellPrice=ValueWhen(Sell,C);
ShortPrice=ValueWhen(Short,C);
CoverPrice=ValueWhen(Cover,C);
Title = EncodeColor(colorWhite)+ "My Magic AFL" + " - " + Name() + " - " + EncodeColor(colorRed)+ Interval(2) + EncodeColor(colorWhite) +
" - " + Date() +" - "+"\n" +EncodeColor(colorRed) +"Op-"+O+" "+"Hi-"+H+" "+"Lo-"+L+" "+
"Cl-"+C+" "+ "Vol= "+ WriteVal(V)+"\n"+
EncodeColor(colorLime)+
WriteIf (Buy , " GO LONG / Reverse Signal at "+C+" ","")+
WriteIf (Sell , " EXIT LONG / Reverse Signal at "+C+" ","")+"\n"+EncodeColor(colorYellow)+
WriteIf(Sell , "Total Profit/Loss for the Last Trade Rs."+(C-BuyPrice)+"","")+
WriteIf(Buy , "Total Profit/Loss for the Last trade Rs."+(SellPrice-C)+"","");
PlotShapes(IIf(Buy, shapeSquare, shapeNone),colorGreen, 0, L, Offset=-40);
PlotShapes(IIf(Buy, shapeSquare, shapeNone),colorLime, 0,L, Offset=-50);
PlotShapes(IIf(Buy, shapeUpArrow, shapeNone),colorWhite, 0,L, Offset=-45);
PlotShapes(IIf(Short, shapeSquare, shapeNone),colorRed, 0, H, Offset=40);
PlotShapes(IIf(Short, shapeSquare, shapeNone),colorOrange, 0,H, Offset=50);
PlotShapes(IIf(Short, shapeDownArrow, shapeNone),colorWhite, 0,H, Offset=-45);
TrendSL=IIf(trend==1,TrendUp,TrendDown);
for(i=BarCount-1;i>1;i--)
{
if(Buy == 1)
{
entry = C;
sig = "BUY";
sl = TrendSL;
tar1 = entry + (entry * .0050);
tar2 = entry + (entry * .0092);
tar3 = entry + (entry * .0179);
bars = i;
i = 0;
}
if(Sell == 1)
{
sig = "SELL";
entry = C;
sl = TrendSL;
tar1 = entry - (entry * .0050);
tar2 = entry - (entry * .0112);
tar3 = entry - (entry * .0212);
bars = i;
i = 0;
}
}
Offset = 20;
Clr = IIf(sig == "BUY", colorLime, colorRed);
ssl = IIf(bars == BarCount-1, TrendSL[BarCount-1], Ref(TrendSL, -1));
sl = ssl[BarCount-1];
Plot(LineArray(bars-Offset, tar1, BarCount, tar1,1), "", Clr, styleLine|styleDots, Null, Null, Offset);
Plot(LineArray(bars-Offset, tar2, BarCount, tar2,1), "", Clr, styleLine|styleDots, Null, Null, Offset);
Plot(LineArray(bars-Offset, tar3, BarCount, tar3,1), "", Clr, styleLine|styleDots, Null, Null, Offset);
//Plot(LineArray(bars-Offset, sl, BarCount, sl,1), "", colorDarkRed, styleLine|styleLine, Null, Null, Offset);
//Plot(LineArray(bars-Offset, entry, BarCount, entry,1), "", colorGreen, styleLine|styleLine, Null, Null, Offset);
/*for (i=bars; i <BarCount;i++)
{
PlotText(""+sig+"@"+entry, BarCount-5,entry,Null,colorBlue);
PlotText("T1@"+tar1,BarCount-5,tar1,Null,Clr);PlotText("T2@"+tar2,BarCount-5,tar2,Null,Clr);PlotText ("T3@"+tar3,BarCount-5,tar3,Null,Clr);
}*/
messageboard = ParamToggle("Message Board","Show|Hide",1);
if (messageboard == 1 )
{
GfxSelectFont( "Tahoma", 13, 100 );
GfxSetBkMode( 1 );
GfxSetTextColor( colorWhite );
if ( sig =="BUY")
{
GfxSelectSolidBrush( colorBlue ); // this is the box background color
}
else
{
GfxSelectSolidBrush( colorRed ); // this is the box background color
}
pxHeight = Status( "pxchartheight" ) ;
xx = Status( "pxchartwidth");
Left = 1100;
width = 310;
x = 5;
x2 = 290;
y = pxHeight;
GfxSelectPen( colorGreen, 1); // broader color
GfxRoundRect( x, y - 98, x2, y , 7, 7 ) ;
GfxTextOut( ( "My Magic"),13,y-100);
GfxTextOut( (" "),27,y-100);
GfxTextOut( ("Last " + sig + " Signal came " + (BarCount-bars-1) * Interval()/60 + " mins ago"), 13, y-80) ; // The text format location
GfxTextOut( ("" + WriteIf(sig =="BUY",sig + " @ ",sig + " @") + " : " + entry), 13, y-60);
GfxTextOut( ("Trailing SL : " + Ref(TrendSL,-1) + " (" + WriteVal(IIf(sig == "SELL",entry-sl,sl-entry), 2.2) + ")"), 13, y-40);
/*GfxTextOut( ("TGT:1 : " + tar1), 13, y -80);
GfxTextOut( ("TGT:2 : " + tar2), 13,y-60);
GfxTextOut( ("TGT:3 : " + tar3), 13,y-40);*/
GfxTextOut( ("Current P/L : " + WriteVal(IIf(sig == "BUY",(C-entry),(entry-C)),2.2)), 13, y-22);;
//Magfied Market Price
FS=Param("Font Size",30,11,100,1);
GfxSelectFont("Times New Roman", FS, 700, True );
GfxSetBkMode( colorWhite );
GfxSetTextColor( ParamColor("Color",colorGreen) );
Hor=Param("Horizontal Position",940,1,1200,1);
Ver=Param("Vertical Position",12,1,830,1);
GfxTextOut(""+C, Hor , Ver );
YC=TimeFrameGetPrice("C",inDaily,-1);
DD=Prec(C-YC,2);
xx=Prec((DD/YC)*100,2);
GfxSelectFont("Times New Roman", 11, 700, True );
GfxSetBkMode( colorBlack );
GfxSetTextColor(ParamColor("Color",colorYellow) );
GfxTextOut(""+DD+" ("+xx+"%)", Hor , Ver+45 );
}
_SECTION_END();
_SECTION_BEGIN("Time Left");
function GetSecondNum()
{
Time = Now( 4 );
Seconds = int( Time % 100 );
Minutes = int( Time / 100 % 100 );
Hours = int( Time / 10000 % 100 );
SecondNum = int( Hours * 60 * 60 + Minutes * 60 + Seconds );
return SecondNum;
}
RequestTimedRefresh( 1 );
TimeFrame = Interval();
SecNumber = GetSecondNum();
Newperiod = SecNumber % TimeFrame == 0;
SecsLeft = SecNumber - int( SecNumber / TimeFrame ) * TimeFrame;
SecsToGo = TimeFrame - SecsLeft;
x=Param("xposn",50,0,1000,1);
y=Param("yposn",380,0,1000,1);
GfxSelectSolidBrush( ColorRGB( 230, 230, 230 ) );
GfxSelectPen( ColorRGB( 230, 230, 230 ), 2 );
if ( NewPeriod )
{
GfxSelectSolidBrush( colorYellow );
GfxSelectPen( colorYellow, 2 );
Say( "New period" );
}
//GfxRoundRect( x+45, y+40, x-3, y-2, 0, 0 );
//GfxSetBkMode(1);
GfxSelectFont( "Arial", 14, 700, False );
GfxSetTextColor( colorRed );
GfxTextOut( "Time Left :"+SecsToGo+"", x, y );
_SECTION_END();
////////////////// PARABOLIC SAR///////////////
_SECTION_BEGIN("PARABOLIC SAR");
/////////////////////////////////
IAF = 0.02; // acceleration factor
MaxAF = 0.2; // max acceleration
psar = Close; // initialize
long = 1; // assume long for initial conditions
af = IAF; // init acelleration factor
ep = Low[ 0 ]; // init extreme point
hp = High [ 0 ];
lp = Low [ 0 ];
for( i = 2; i < BarCount; i++ )
{
if ( long )
{
psar [ i ] = psar [ i-1 ] + af * ( hp - psar [ i-1 ] );
}
else
{
psar [ i ] = psar [ i-1 ] + af * ( lp - psar [ i-1 ] );
}
reverse = 0;
//check for reversal
if ( long )
{
if ( Low [ i ] < psar [ i ] )
{
long = 0; reverse = 1; // reverse position to Short
psar [ i ] = hp; // SAR is High point in prev trade
lp = Low [ i ];
af = IAF;
}
}
else
{
if ( High [ i ] > psar [ i ] )
{
long = 1; reverse = 1; //reverse position to long
psar [ i ] = lp;
hp = High [ i ];
af = IAF;
}
}
if ( reverse == 0 )
{
if ( long )
{
if ( High [ i ] > hp )
{
hp = High [ i ];
af = af + IAF;
if( af > MaxAF ) af = MaxAF;
}
if( Low[ i - 1 ] < psar[ i ] ) psar[ i ] = Low[ i - 1 ];
if( Low[ i - 2 ] < psar[ i ] ) psar[ i ] = Low[ i - 2 ];
}
else
{
if ( Low [ i ] < lp )
{
lp = Low [ i ];
af = af + IAF;
if( af > MaxAF ) af = MaxAF;
}
if( High[ i - 1 ] > psar[ i ] ) psar[ i ] = High[ i - 1 ];
if( High[ i - 2 ] > psar[ i ] ) psar[ i ] = High[ i - 2 ];
}
}
}
//Plot( Close, "Price", colorBlack, styleCandle );
Plot( psar, "SAR", colorRed, styleDots | styleNoLine | styleThick );
range = 15;//Param("Periods", 14, 2, 200, 1 );
ADXi=ADX(range);
PDIi=PDI(range);
MDIi=MDI(range);
//Plot( ADXi=ADX(range), _DEFAULT_NAME(), ParamColor( "ADX color", colorBlue ), ParamStyle("ADX style", styleThick ) );
//Plot( PDIi=PDI(range), "", ParamColor( "+DI color", colorGreen ), ParamStyle("+DI style") );
//Plot( MDIi=MDI(range), "", ParamColor( "-DI color", colorRed ), ParamStyle("-DI style") );
uptrend=PDIi>MDIi;//+di greater than -di
downtrend=MDIi>PDIi;//-di greater than +di
Ribboncol=IIf(upTrend,colorGreen, IIf(downtrend,colorRed, colorBlack));
Plot(6, "", Ribboncol, styleOwnScale|styleArea|styleNoLabel, -7.5,100);
Buy=Cross(L,psar) AND uptrend;
Sell=Cross(psar,H) AND downtrend;
//PlotShapes(Sell*shapeDownArrow,colorRed);
//PlotShapes(Buy*shapeUpArrow,colorGreen);
_SECTION_END();
_SECTION_BEGIN("Kill The Operator MACD");
SetChartBkColor(ParamColor("Panel color ",colorBlack));
r1 = Param( "Fast avg", 12, 2, 200, 1 );
r2 = Param( "Slow avg", 26, 2, 200, 1 );
r3 = Param( "Signal avg", 9, 2, 200, 1 );
Plot( ml = MACD(r1, r2), StrFormat(_SECTION_NAME()+"(%g,%g)", r1, r2), ParamColor("MACD color", colorRed ), ParamStyle("MACD style") );
Plot( sl = Signal(r1,r2,r3), "Signal" + _PARAM_VALUES(), ParamColor("Signal color", colorBlue ), ParamStyle("Signal style") );
Histogram_color = IIf( ml-sl > 0, colorBlue, colorRed);
Plot( ml-sl, "MACD Histogram", Histogram_color, styleNoTitle | ParamStyle("Histogram style", styleHistogram | styleThick | styleNoLabel, maskHistogram ) );
Title = EncodeColor(colorWhite)+ "Kill The Operator MACD";
_SECTION_END();
x = ml;
y = sl;
Buy=Cross(x,y);
PlotShapes(shapeUpArrow*Buy,colorBlue);
Sell=Cross(y,x);
PlotShapes(shapeDownArrow*Sell,colorYellow);
AlertIf( Buy, "SOUND C:\\Windows\\Media\\notify.wav", "Audio alert", 2 );
AlertIf( Sell, "SOUND C:\\Windows\\Media\\chord.wav", "Audio alert", 2 );
/* Trend Filters */
TimeFrameSet(in15Minute);
SwingTrd151 = 100 * (Close - ((MA(C,2)+
MA(MA(C,2),2)+
MA(MA(MA(C,2),2),2) +
MA(MA(MA(MA(C,2),2),2),2) +
MA(MA(MA(MA(MA(C,2),2),2),2),2) +
MA(MA(MA(MA(MA(MA(C,2),2),2),2),2),2) +
MA(MA(MA(MA(MA(MA(MA(C,2),2),2),2),2),2),2)+
MA(MA(MA(MA(MA(MA(MA(MA(C,2),2),2),2),2),2),2),2)+
MA(MA(MA(MA(MA(MA(MA(MA(MA(C,2),2),2),2),2),2),2), 2),2)+
MA(MA(MA(MA(MA(MA(MA(MA(MA(MA(C,2),2),2),2),2),2), 2),2),2),2))
/10))/(HHV(C,10)-LLV(C,10));
SwingTrd152=EMA(SwingTrd151,13);
SwingTrd153=EMA(SwingTrd152,13);
RMO15= EMA(SwingTrd151,34);
Bull_Trend15=EMA(SwingTrd151,34)>0;
Bear_Trend15=EMA(SwingTrd151,34)<0;
TimeFrameRestore();
Ribbon_kol15=IIf(TimeFrameExpand(Bull_Trend15,in15Minute),colorBlue, IIf(TimeFrameExpand(Bear_Trend15,in15Minute),colorRed, colorBlack));
Plot(2, "ribbon", Ribbon_kol15, styleOwnScale|styleArea|styleNoLabel, -0.5,100);
TimeFrameSet(10*in1Minute);
SwingTrd101 = 100 * (Close - ((MA(C,2)+
MA(MA(C,2),2)+
MA(MA(MA(C,2),2),2) +
MA(MA(MA(MA(C,2),2),2),2) +
MA(MA(MA(MA(MA(C,2),2),2),2),2) +
MA(MA(MA(MA(MA(MA(C,2),2),2),2),2),2) +
MA(MA(MA(MA(MA(MA(MA(C,2),2),2),2),2),2),2)+
MA(MA(MA(MA(MA(MA(MA(MA(C,2),2),2),2),2),2),2),2)+
MA(MA(MA(MA(MA(MA(MA(MA(MA(C,2),2),2),2),2),2),2), 2),2)+
MA(MA(MA(MA(MA(MA(MA(MA(MA(MA(C,2),2),2),2),2),2), 2),2),2),2))
/10))/(HHV(C,10)-LLV(C,10));
SwingTrd102=
EMA(SwingTrd101,13);
SwingTrd103=EMA(SwingTrd102,13);
RMO10= EMA(SwingTrd101,34);
Bull_Trend10=EMA(SwingTrd101,34)>0;
Bear_Trend10=EMA(SwingTrd101,34)<0;
TimeFrameRestore();
Ribbon_kol10=IIf(TimeFrameExpand(Bull_Trend10,10*in1Minute),colorBlue, IIf(TimeFrameExpand(Bear_Trend10,10*in1Minute),colorRed, colorBlack));
Plot(4, "ribbon", Ribbon_kol10, styleOwnScale|styleArea|styleNoLabel, -0.5,100);
SwingTrd1 = 100 * (Close - ((MA(C,2)+
MA(MA(C,2),2)+
MA(MA(MA(C,2),2),2) +
MA(MA(MA(MA(C,2),2),2),2) +
MA(MA(MA(MA(MA(C,2),2),2),2),2) +
MA(MA(MA(MA(MA(MA(C,2),2),2),2),2),2) +
MA(MA(MA(MA(MA(MA(MA(C,2),2),2),2),2),2),2)+
MA(MA(MA(MA(MA(MA(MA(MA(C,2),2),2),2),2),2),2),2)+
MA(MA(MA(MA(MA(MA(MA(MA(MA(C,2),2),2),2),2),2),2), 2),2)+
MA(MA(MA(MA(MA(MA(MA(MA(MA(MA(C,2),2),2),2),2),2), 2),2),2),2))
/10))/(HHV(C,10)-LLV(C,10));
SwingTrd2=
EMA(SwingTrd1,13);
SwingTrd3=
EMA(SwingTrd2,13);
RMO= EMA(SwingTrd1,34);
Bull_Trend=EMA(SwingTrd1,34)>0;
Bear_Trend=EMA(SwingTrd1,34)<0;
Ribbon_kol=IIf(Bull_Trend,colorBlue, IIf(Bear_Trend,colorRed, colorBlack));
Plot(6, "ribbon", Ribbon_kol, styleOwnScale|styleArea|styleNoLabel, -0.5,100);
// End of Trend Filters
These are TWO AFL
Test This AFL for 30 Minutes Timeframe. WHen both give Buy or Sell Simultaneously then only enter in trade
If ribbon is red then ignore buy calls
If ribbon is green then ignore sell calls
put up your results for others
make two separate AFLs in Separate windows
first afl is ok and Im getting error in second afl sir ...
AFL is :
_SECTION_BEGIN("Kill The Operator MACD");
SetChartBkColor(ParamColor("Panel color ",colorBlack));
r1 = Param( "Fast avg", 12, 2, 200, 1 );
r2 = Param( "Slow avg", 26, 2, 200, 1 );
r3 = Param( "Signal avg", 9, 2, 200, 1 );
Plot( ml = MACD(r1, r2), StrFormat(_SECTION_NAME()+"(%g,%g)", r1, r2), ParamColor("MACD color", colorRed ), ParamStyle("MACD style") );
Plot( sl = Signal(r1,r2,r3), "Signal" + _PARAM_VALUES(), ParamColor("Signal color", colorBlue ), ParamStyle("Signal style") );
Histogram_color = IIf( ml-sl > 0, colorBlue, colorRed);
Plot( ml-sl, "MACD Histogram", Histogram_color, styleNoTitle | ParamStyle("Histogram style", styleHistogram | styleThick | styleNoLabel, maskHistogram ) );
Title = EncodeColor(colorWhite)+ "Kill The Operator MACD";
_SECTION_END();
x = ml;
y = sl;
Buy=Cross(x,y);
PlotShapes(shapeUpArrow*Buy,colorBlue);
Sell=Cross(y,x);
PlotShapes(shapeDownArrow*Sell,colorYellow);
AlertIf( Buy, "SOUND C:\\Windows\\Media\\notify.wav", "Audio alert", 2 );
AlertIf( Sell, "SOUND C:\\Windows\\Media\\chord.wav", "Audio alert", 2 );
/* Trend Filters */
TimeFrameSet(in15Minute);
SwingTrd151 = 100 * (Close - ((MA(C,2)+
MA(MA(C,2),2)+
MA(MA(MA(C,2),2),2) +
MA(MA(MA(MA(C,2),2),2),2) +
MA(MA(MA(MA(MA(C,2),2),2),2),2) +
MA(MA(MA(MA(MA(MA(C,2),2),2),2),2),2) +
MA(MA(MA(MA(MA(MA(MA(C,2),2),2),2),2),2),2)+
MA(MA(MA(MA(MA(MA(MA(MA(C,2),2),2),2),2),2),2),2)+
MA(MA(MA(MA(MA(MA(MA(MA(MA(C,2),2),2),2),2),2),2), 2),2)+
MA(MA(MA(MA(MA(MA(MA(MA(MA(MA(C,2),2),2),2),2),2), 2),2),2),2))
/10))/(HHV(C,10)-LLV(C,10));
SwingTrd152=EMA(SwingTrd151,13);
SwingTrd153=EMA(SwingTrd152,13);
RMO15= EMA(SwingTrd151,34);
Bull_Trend15=EMA(SwingTrd151,34)>0;
Bear_Trend15=EMA(SwingTrd151,34)<0;
TimeFrameRestore();
Ribbon_kol15=IIf(TimeFrameExpand(Bull_Trend15,in15 Minute),colorBlue, IIf(TimeFrameExpand(Bear_Trend15,in15Minute),color Red, colorBlack));
Plot(2, "ribbon", Ribbon_kol15, styleOwnScale|styleArea|styleNoLabel, -0.5,100);
TimeFrameSet(10*in1Minute);
SwingTrd101 = 100 * (Close - ((MA(C,2)+
MA(MA(C,2),2)+
MA(MA(MA(C,2),2),2) +
MA(MA(MA(MA(C,2),2),2),2) +
MA(MA(MA(MA(MA(C,2),2),2),2),2) +
MA(MA(MA(MA(MA(MA(C,2),2),2),2),2),2) +
MA(MA(MA(MA(MA(MA(MA(C,2),2),2),2),2),2),2)+
MA(MA(MA(MA(MA(MA(MA(MA(C,2),2),2),2),2),2),2),2)+
MA(MA(MA(MA(MA(MA(MA(MA(MA(C,2),2),2),2),2),2),2), 2),2)+
MA(MA(MA(MA(MA(MA(MA(MA(MA(MA(C,2),2),2),2),2),2), 2),2),2),2))
/10))/(HHV(C,10)-LLV(C,10));
SwingTrd102=
EMA(SwingTrd101,13);
SwingTrd103=EMA(SwingTrd102,13);
RMO10= EMA(SwingTrd101,34);
Bull_Trend10=EMA(SwingTrd101,34)>0;
Bear_Trend10=EMA(SwingTrd101,34)<0;
TimeFrameRestore();
Ribbon_kol10=IIf(TimeFrameExpand(Bull_Trend10,10*i n1Minute),colorBlue, IIf(TimeFrameExpand(Bear_Trend10,10*in1Minute),col orRed, colorBlack));
Plot(4, "ribbon", Ribbon_kol10, styleOwnScale|styleArea|styleNoLabel, -0.5,100);
SwingTrd1 = 100 * (Close - ((MA(C,2)+
MA(MA(C,2),2)+
MA(MA(MA(C,2),2),2) +
MA(MA(MA(MA(C,2),2),2),2) +
MA(MA(MA(MA(MA(C,2),2),2),2),2) +
MA(MA(MA(MA(MA(MA(C,2),2),2),2),2),2) +
MA(MA(MA(MA(MA(MA(MA(C,2),2),2),2),2),2),2)+
MA(MA(MA(MA(MA(MA(MA(MA(C,2),2),2),2),2),2),2),2)+
MA(MA(MA(MA(MA(MA(MA(MA(MA(C,2),2),2),2),2),2),2), 2),2)+
MA(MA(MA(MA(MA(MA(MA(MA(MA(MA(C,2),2),2),2),2),2), 2),2),2),2))
/10))/(HHV(C,10)-LLV(C,10));
SwingTrd2=
EMA(SwingTrd1,13);
SwingTrd3=
EMA(SwingTrd2,13);
RMO= EMA(SwingTrd1,34);
Bull_Trend=EMA(SwingTrd1,34)>0;
Bear_Trend=EMA(SwingTrd1,34)<0;
Ribbon_kol=IIf(Bull_Trend,colorBlue, IIf(Bear_Trend,colorRed, colorBlack));
Plot(6, "ribbon", Ribbon_kol, styleOwnScale|styleArea|styleNoLabel, -0.5,100);
// End of Trend Filters
ERROR IM GETTING IS :
ERROR 29.
Variable "ribbon_kol10" used without having been initialized.
Use edit formula to correct error
( sir plz help me out how to rectify this error )
thanks
| Thread starter | Similar threads | Forum | Replies | Date |
|---|---|---|---|---|
| G | Need Help with converting this Pinescript to AFL | AmiBroker | 1 | |
| T | Seniors: Need Help. Stochastic on Price Chart AFL | AmiBroker | 2 | |
| D | seniors pls help need afl | AmiBroker | 5 | |
| D | need afl urgently seniors pls help | AmiBroker | 2 | |
| J | Need Afl for the given smash day conditions..Afl experts or seniors help me? | AmiBroker | 3 |
Similar threads
-
-
-
-
-
Need Afl for the given smash day conditions..Afl experts or seniors help me?
- Started by jaytrader
- Replies: 3