


Hi frnds,
i got this this afl from Subhim's collection.
Need help on this one.
My queries:
1) I tried changing the PercentChange = 6; but its not givin me right signals when im changin it.
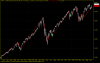
2) When im pressin the backtest button, im not gettin proper report. if utry this on nifty for last 2 yrs , u get just 52% gains. where as the real chart indicates much more better performance.
Thanks in advance
i got this this afl from Subhim's collection.
Need help on this one.
My queries:
1) I tried changing the PercentChange = 6; but its not givin me right signals when im changin it.
2) When im pressin the backtest button, im not gettin proper report. if utry this on nifty for last 2 yrs , u get just 52% gains. where as the real chart indicates much more better performance.
//z_ZigZagValid
// ******** CHARTING
PercentChange = 6;
mystartbar = SelectedValue(BarIndex()); // FOR GRAPHING
mystartbardate = LastValue(ValueWhen(mystartbar == BarIndex(), DateNum(),1));
InitialValue = LastValue(ValueWhen(mystartbardate == DateNum(), C , 1 ) ) ;
Temp1 = IIf(BarIndex() >= mystartbar, InitialValue, Null) ;
Plot(Temp1, " ", colorBlack,styleLine);
Plot((1+(LastValue(PercentChange)/100))*(Temp1), " ", colorGreen, styleLine) ;
Plot((1-(LastValue(PercentChange)/100))*(Temp1), " ", colorRed, styleLine) ;
ZZ = Zig(C,LastValue(PercentChange)) ;
PivotLow = Ref(IIf(Ref(ROC(ZZ,1),-1) < 0 AND ROC(ZZ,1) > 0, 1, Null),1);
PivotHigh = Ref(IIf(Ref(ROC(ZZ,1),-1) > 0 AND ROC(ZZ,1) < 0, 1, Null),1);
PlotShapes( shapeCircle*PivotLow, colorGreen,0, L, -20) ;
PlotShapes( shapeCircle*PivotHigh,colorRed,0,H, 20) ;
Buy = IIf(C>(1+(LastValue(PercentChange)/100))*(ValueWhen(PivotLow, C, 1))
AND ROC(ZZ,1) > 0,1,0);
Sell = IIf(C<(1-(LastValue(PercentChange)/100))*(ValueWhen(PivotHigh, C, 1))
AND ROC(ZZ,1) < 0,1,0);
Buy = ExRem(Buy,Sell);
Sell = ExRem(Sell,Buy);
PlotShapes( shapeUpArrow*Buy, colorGreen,0, L, -20);
PlotShapes( shapeDownArrow*Sell, colorRed,0,H, -20) ;
BarColors =
IIf(BarsSince(Buy) < BarsSince(Sell)
AND BarsSince(Buy)!=0, colorGreen,
IIf(BarsSince(Sell) < BarsSince(Buy)
AND BarsSince(Sell)!=0, colorRed, colorBlue));
Plot(C, " ", BarColors, styleBar ) ;
Plot(ZZ," ", colorLightGrey,styleLine|styleThick);
Plot(ZZ," ", BarColors,styleDots|styleNoLine);
Title = Name() + " " + Date() + WriteIf(PivotLow, " Up Pivot ","")+WriteIf(PivotHigh," Down Pivot ","")+ WriteIf(Buy, " Buy Point ", "") + WriteIf(Sell, " Sell Point ", "") ;
AlertIf(Buy, "", "",1,1 );
AlertIf(Sell, "", "",2,1 );
Attachments
-
 15.5 KB Views: 360