


Hi Seniors and Others,
I use Amibroker with 5 /15 mins intraday data . I need the following .
1. Plotting of EMA 15 ( 5 mins time frame )
2. Plotting of EMA 12 ( Daily time frame... it is constant )
3. Cross over buy and sell signal of the above
I tried plotting the above . I m getting the values ... But i am not getting the Crossover buy and selll...its plotting wrong buy and sell signals ...
The AFL IS AS BELOW :
_SECTION_BEGIN("Price");
SetChartOptions(0,chartShowArrows|chartShowDates);
_N(Title = StrFormat("{{NAME}} - {{INTERVAL}} {{DATE}} Open %g, Hi %g, Lo %g, Close %g (%.1f%%) {{VALUES}}", O, H, L, C, SelectedValue( ROC( C, 1 ) ) ));
Plot( C, "Close", ParamColor("Color", colorBlack ), styleNoTitle | ParamStyle("Style") | GetPriceStyle() );
_SECTION_END();
_SECTION_BEGIN("EMA");
Range1=Optimize("range1",15,1,20,1);
// plot expanded average
Plot(EMA(Close,range1), "", colorRed,styleDots );
_SECTION_END();
_SECTION_BEGIN("day");
TimeFrameSet( inDaily-1 ); // switch now to daily
ek=EMA(C,12);
Plot( TimeFrameExpand( ek, inDaily),"Powe", colorBrightGreen,10+30+4| styleNoRescale|styleNoTitle);
_SECTION_END();
Range1=Optimize("range1",15,1,20,1);
Buy = Cross((EMA(Close,range1)),(ek));
Sell = Cross((ek),(EMA(Close,range1)));
Short = Sell;
Cover = Buy;
// plot arrows
shape = Buy * shapeUpTriangle + Sell * shapeDownTriangle;
PlotShapes( shape, IIf( Buy, colorWhite, colorYellow ), 0, IIf( Buy, Low, High ) );
dist = 3.5*ATR(5);
for( i = 0; i < BarCount; i++ )
{
if( Buy ) PlotText( "Buy\n@" + C[ i ], i, L[ i ]-dist,2, colorGreen );
if( Sell ) PlotText( "Sell\n@" + C[ i ], i, H[ i ]+dist, colorWhite,colorRed );
}
AFL IS CORRECT ... PLOTTING ALSO IS CORRECT ..... BUT PROBLEM IS I AM GETTING BUY / SELL SIGNAL WRONGLY
PLZ SOLVE THIS PROBLEM of MINE..
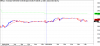
Check the Images for Understanding the issue
Need a BUY/SELL signal For the RED LINE CROSSING OVER THE GREEN LINE[/SIZE]
Thanks in advance.
Regards,
Kumar
I use Amibroker with 5 /15 mins intraday data . I need the following .
1. Plotting of EMA 15 ( 5 mins time frame )
2. Plotting of EMA 12 ( Daily time frame... it is constant )
3. Cross over buy and sell signal of the above
I tried plotting the above . I m getting the values ... But i am not getting the Crossover buy and selll...its plotting wrong buy and sell signals ...
The AFL IS AS BELOW :
_SECTION_BEGIN("Price");
SetChartOptions(0,chartShowArrows|chartShowDates);
_N(Title = StrFormat("{{NAME}} - {{INTERVAL}} {{DATE}} Open %g, Hi %g, Lo %g, Close %g (%.1f%%) {{VALUES}}", O, H, L, C, SelectedValue( ROC( C, 1 ) ) ));
Plot( C, "Close", ParamColor("Color", colorBlack ), styleNoTitle | ParamStyle("Style") | GetPriceStyle() );
_SECTION_END();
_SECTION_BEGIN("EMA");
Range1=Optimize("range1",15,1,20,1);
// plot expanded average
Plot(EMA(Close,range1), "", colorRed,styleDots );
_SECTION_END();
_SECTION_BEGIN("day");
TimeFrameSet( inDaily-1 ); // switch now to daily
ek=EMA(C,12);
Plot( TimeFrameExpand( ek, inDaily),"Powe", colorBrightGreen,10+30+4| styleNoRescale|styleNoTitle);
_SECTION_END();
Range1=Optimize("range1",15,1,20,1);
Buy = Cross((EMA(Close,range1)),(ek));
Sell = Cross((ek),(EMA(Close,range1)));
Short = Sell;
Cover = Buy;
// plot arrows
shape = Buy * shapeUpTriangle + Sell * shapeDownTriangle;
PlotShapes( shape, IIf( Buy, colorWhite, colorYellow ), 0, IIf( Buy, Low, High ) );
dist = 3.5*ATR(5);
for( i = 0; i < BarCount; i++ )
{
if( Buy ) PlotText( "Buy\n@" + C[ i ], i, L[ i ]-dist,2, colorGreen );
if( Sell ) PlotText( "Sell\n@" + C[ i ], i, H[ i ]+dist, colorWhite,colorRed );
}
AFL IS CORRECT ... PLOTTING ALSO IS CORRECT ..... BUT PROBLEM IS I AM GETTING BUY / SELL SIGNAL WRONGLY
PLZ SOLVE THIS PROBLEM of MINE..
Check the Images for Understanding the issue
Need a BUY/SELL signal For the RED LINE CROSSING OVER THE GREEN LINE[/SIZE]
Thanks in advance.
Regards,
Kumar
Attachments
-
 19.2 KB Views: 202
Last edited: