


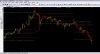
As mentioned in my earlier post ,please go through the attached image and guide me to remove the old fib.levels. I want only the latest level plotted ,on the screen.
this is the code:
_SECTION_BEGIN("Unnamed 44");
Version(5.20);
SetChartBkColor(16);
SetBarsRequired(sbrAll);
GraphXSpace=Param("GraphXSpace",15,-100,300,1);
daynum= Now(9);//day of the week
SatSun= IIf((daynum==1 OR daynum==7),1,0);
dec= IIf(StrRight(Name(),3) == "", 3.2, 3.2);
dec= (Param("Decimals",2,0,7,1)/10)+1;
uc= ParamColor("Up Candle Fill Color",19);
dc= ParamColor("Dn Candle Fill Color",24);
nc= ParamColor("Neutral Fill Color",21);
bc= BarCount-1;
x= BarIndex();
Lx= LastValue(x);
sx= SelectedValue(x);
//==============================
SetBarFillColor(IIf(C>O,uc,IIf(C<O,dc,nc)));
Plot(C,"",IIf(C>Ref(C,-1),34,IIf(C<Ref(C,-1),32,42)),64);
_SECTION_END();
_SECTION_END();
_SECTION_BEGIN("Fibonacci Fractals");
/*Fractals and Fib Levels
by Ipeleng Molete
30 October 2011
*/
fral= Param("Fractal Periods",13,1,50,1);
PHigh = H > Ref(HHV(H,fral),-1) AND Ref(HHV(H,fral),fral) <= H;
PHighPrice = ValueWhen(PHigh,H);
PLow = L < Ref(LLV(L,fral),-1) AND Ref(LLV(L,fral),fral) >= L;
PLowPrice = ValueWhen(PLow,L);
Bear = ValueWhen(PHigh, DateTime());
Bull = ValueWhen(PLow, DateTime());
PlotShapes(shapeUpArrow*PLow,colorGreen,0,L,-10);
PlotShapes(shapeDownArrow*PHigh,colorRed,0,H,-9);
//Plot(PLowPrice, "Fractal Low", colorGreen, styleDots | styleNoLine);
//Plot(PHighPrice, "Fractal High", colorRed, styleDots | styleNoLine);
phase = IIf(bull > bear, 0, 1);
//Fib Level Calculation
//If previous fractal was down fractal, then Fib Level is worked out
//by subtracting the down fractal from the up fractal and vice versa
HiLoDifference = IIf(phase == 0, PLowPrice - PHighPrice, PHighPrice - PLowPrice);
Level1 = abs(HiLoDifference)*0.236;
Level2 = abs(HiLoDifference)*0.382;
Level3 = abs(HiLoDifference)*0.618;
Level4 = abs(HiLoDifference)*0.784;
Level5 = abs(HiLoDifference)*1.0;
Level6 = abs(HiLoDifference)*1.272;
Level7 = abs(HiLoDifference)*1.618;
Level8 = abs(HiLoDifference)*2.618;
Level0236 = IIf(phase == 0, PLowPrice + Level1, PHighPrice - Level1);
Level0382 = IIf(phase == 0, PLowPrice + Level2, PHighPrice - Level2);
Level0618 = IIf(phase == 0, PLowPrice + Level3, PHighPrice - Level3);
Level0784 = IIf(phase == 0, PLowPrice + Level4, PHighPrice - Level4);
Level10 = IIf(phase == 0, PLowPrice + Level5, PHighPrice - Level5);
Level1272 = IIf(phase == 0, PLowPrice + Level6, PHighPrice - Level6);
Level1618 = IIf(phase == 0, PLowPrice + Level7, PHighPrice - Level7);
Level2618 = IIf(phase == 0, PLowPrice + Level8, PHighPrice - Level8);
//Graph
Plot(Level0236,"23.6%=",colorWhite, styleDots | styleNoLine|styleNoRescale );
Plot(Level0382,"38.2%=",colorGreen, styleDots | styleNoLine|styleNoRescale );
Plot(Level0618,"61.8%=",colorRed, styleDots | styleNoLine|styleNoRescale );
Plot(Level0784,"78.4%=",colorRed, styleDots | styleNoLine|styleNoRescale );
Plot(Level1272,"127.2%=",colorBlue, styleDots | styleNoLine|styleNoRescale );
Plot(Level1618,"161.8%=",colorSkyblue, styleDots | styleNoLine|styleNoRescale );
Plot(Level2618,"261.8%=",colorPink, styleDots | styleNoLine|styleNoRescale );
BarTime1=LastValue(TimeNum() - Now(4));
DataError=IIf(Now(4) > TimeNum(),True,False);
TimeBase=IIf(Interval(1)>0,1,0);
_N(StrBarTime=NumToStr(BarTime1,1.0,False));
BT_Length=StrLen(StrBarTime);
_N(TimeLeft_=
WriteIf(BT_Length==1,"0:0"+StrBarTime,WriteIf(BT_Length==2,"0:"+StrBarTime,
WriteIf(BT_Length==3,StrLeft(StrBarTime,1)+":"+StrRight(StrBarTime,2),
StrLeft(StrBarTime,2)+":"+StrRight(StrBarTime,2)))));
TimeLeft=WriteIf(TimeBase==1,TimeLeft_,"N/A");
_SECTION_END();
