


Dear Traderji and All members,
I have a question on overbought/oversold signal.
It is said if both the stoch goes above 80 ( or goes below 20) then the market is overbought ( or oversold ), and those point are excellent for going short ( or long).
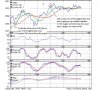
My question is, most of the time this is true but not always. For example, in day chart, I am seeing market is overbought, but even after that, it doesnt go down, instead go up and stoch remaines overbought. ( see the attachment, both point 1 and 2 are overbought, however afer point 1, price fell down, not same for point2).
I saw a similar question on this forun, where it is asked to look at momentum indicator like MACD, but those signal are enough slow, by the time it shows indication price changes very much for day trade.
I follow Yahoo! finance chart
Thanks
Nirmalya
I have a question on overbought/oversold signal.
It is said if both the stoch goes above 80 ( or goes below 20) then the market is overbought ( or oversold ), and those point are excellent for going short ( or long).
My question is, most of the time this is true but not always. For example, in day chart, I am seeing market is overbought, but even after that, it doesnt go down, instead go up and stoch remaines overbought. ( see the attachment, both point 1 and 2 are overbought, however afer point 1, price fell down, not same for point2).
I saw a similar question on this forun, where it is asked to look at momentum indicator like MACD, but those signal are enough slow, by the time it shows indication price changes very much for day trade.
I follow Yahoo! finance chart
Thanks
Nirmalya
Attachments
-
 65.6 KB Views: 171
")