


Hello Friends,
I required help buy re-entry and sell re-Entry for below mention afl code.
_SECTION_BEGIN("Price");
SetChartOptions(0,chartShowArrows|chartShowDates);
_N(Title = StrFormat("{{NAME}} - {{INTERVAL}} {{DATE}} Open %g, Hi %g, Lo %g, Close %g (%.1f%%) {{VALUES}}", O, H, L, C, SelectedValue( ROC( C, 1 ) ) ));
Plot( C, "Close", ParamColor("Color", colorDefault ), styleNoTitle | ParamStyle("Style") | GetPriceStyle() );
ChannelPeriods = Param("Channel Periods",10,1,50,1);
AvgPeriods = Param("Average Periods",21,1,50,1);
n1 = ChannelPeriods; // Channel periodsdefault is 10.
n2 = AvgPeriods; // Average periodsdefault is 21.
AP = Avg; //Typical Price
ESA = EMA(AP, n1);
D = EMA(abs(AP - ESA), n1);
CI = (AP - ESA) / (0.015 * D);
TCI = EMA(CI, n2);
WaveTrend1 = TCI;
WaveTrend2 = MA(WaveTrend1,4);
myColor =
IIf (WaveTrend1 > WaveTrend2, colorLavender,
IIf (WaveTrend2 > WaveTrend1, colorRed ,colorLightYellow));
//Plot(WaveTrend1,"WaveTrend ",myColor,styleDots | styleThick);
//Plot(WaveTrend2,"WaveTrend2",colorLightYellow,styl eDashed);
//Plot(WaveTrend2,"WaveTrend2",ParamColor("Signal Line color", colorPaleBlue),styleDots);
//Plot(OverBought,"OB Line",ColOB,8+16);//|styleNoLabel);//8+16
//Plot(OverSold,"OS Line",ColOS,8+16);//|styleNoLabel);
//Plot(n1,"Channel Periods",colorBlue,styleNoLabel |styleNoRescale |styleNoDraw);
//Plot(n2,"Avg Periods",colorBlue,styleNoLabel |styleNoRescale | styleNoDraw);
//Plot(0,"0",colorRed,styleNoLabel);
//Plot(100,"",9 ,styleOwnScale | styleArea | styleNoLabel,-5,100);
//Background pane coloring
bSetup=Cross(WaveTrend1,WaveTrend2);
sSetup=Cross(waveTrend2,WaveTrend1);
BuySetupValue = ValueWhen(bSetup,H,1);
SellsetupValue = ValueWhen(sSetup,L,1);
Longa = Flip(Bsetup,Ssetup);
shrta = Flip(Ssetup,Bsetup);
Buy1 = Longa AND Cross(C,BuySetupValue);
Sell1 = shrta AND Cross(SellsetupValue,C);
Buy1 = ExRem(Buy1,Sell1);
Sell1 = ExRem(Sell1,Buy1);
shape=Buy1*shapeUpArrow+Sell1*shapeDownArrow;
PlotShapes( shape, IIf( Buy1, colorWhite, colorYellow ), 0, IIf( Buy1, L-1, IIf(Sell1,H+1,Null)));
Buy2=Close>EMA(Close,50);
Sell2=Close<EMA(Close,50);
Buy2 = ExRem(Buy2,Sell2);
Sell2 = ExRem(Sell2,Buy2);
shape=Buy2*shapeUpArrow+Sell2*shapeDownArrow;
PlotShapes( shape, IIf( Buy2, colorGreen, colorRed ), 0, IIf( Buy2, L-1, IIf(Sell2,H+1,Null)));
Buy=Buy1 AND Buy2;
Sell=Sell1 AND Sell2;
shape=Buy2*shapeUpArrow+Sell2*shapeDownArrow;
PlotShapes( shape, IIf( Buy, colorGreen, colorRed ), 0, IIf( Buy, L-1, IIf(Sell,H+1,Null)));
_SECTION_END();
_SECTION_BEGIN("EMA1");
P = ParamField("Price field",-1);
Periods = Param("Periods", 15, 2, 300, 1, 10 );
Plot( EMA( P, Periods ), _DEFAULT_NAME(), ParamColor( "Color", colorCycle ), ParamStyle("Style") );
_SECTION_END();
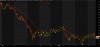
i have attached chart image here for easy reference. in that chart when price close below or above 50 EMA and Wavetrend Crossover come in a same candle then buy and sell signal triggers.
white and yellow is for re-entry for buy or sell.
BUT What i Rquired is
buy IF : Close Above 50 EMA And LATER it has Positive WaveTrend Crossover
buy IF : Positive WaveTrend Crossover and Later Price Close Above 50 Ema its A buy
buy exit : if Price is Above 50 Ema and Negative Wavetrend Crossover comes its a long exit only.
Buy Re-Entry : if Price is above 50 Ema and positive corssover comes its a buy or buy Re-Entry.
For Sell all condition is reversed. if i get buy codes i will write sell coding with help of that..
if you can help me with this formula and condition it will be very much helpful for me. I spent lot of time but didn't get desired outcome. searched a lot and tried many codes and condition but error never goes.
plz help me with this..
Thanx Friends,
Chetan
I required help buy re-entry and sell re-Entry for below mention afl code.
_SECTION_BEGIN("Price");
SetChartOptions(0,chartShowArrows|chartShowDates);
_N(Title = StrFormat("{{NAME}} - {{INTERVAL}} {{DATE}} Open %g, Hi %g, Lo %g, Close %g (%.1f%%) {{VALUES}}", O, H, L, C, SelectedValue( ROC( C, 1 ) ) ));
Plot( C, "Close", ParamColor("Color", colorDefault ), styleNoTitle | ParamStyle("Style") | GetPriceStyle() );
ChannelPeriods = Param("Channel Periods",10,1,50,1);
AvgPeriods = Param("Average Periods",21,1,50,1);
n1 = ChannelPeriods; // Channel periodsdefault is 10.
n2 = AvgPeriods; // Average periodsdefault is 21.
AP = Avg; //Typical Price
ESA = EMA(AP, n1);
D = EMA(abs(AP - ESA), n1);
CI = (AP - ESA) / (0.015 * D);
TCI = EMA(CI, n2);
WaveTrend1 = TCI;
WaveTrend2 = MA(WaveTrend1,4);
myColor =
IIf (WaveTrend1 > WaveTrend2, colorLavender,
IIf (WaveTrend2 > WaveTrend1, colorRed ,colorLightYellow));
//Plot(WaveTrend1,"WaveTrend ",myColor,styleDots | styleThick);
//Plot(WaveTrend2,"WaveTrend2",colorLightYellow,styl eDashed);
//Plot(WaveTrend2,"WaveTrend2",ParamColor("Signal Line color", colorPaleBlue),styleDots);
//Plot(OverBought,"OB Line",ColOB,8+16);//|styleNoLabel);//8+16
//Plot(OverSold,"OS Line",ColOS,8+16);//|styleNoLabel);
//Plot(n1,"Channel Periods",colorBlue,styleNoLabel |styleNoRescale |styleNoDraw);
//Plot(n2,"Avg Periods",colorBlue,styleNoLabel |styleNoRescale | styleNoDraw);
//Plot(0,"0",colorRed,styleNoLabel);
//Plot(100,"",9 ,styleOwnScale | styleArea | styleNoLabel,-5,100);
//Background pane coloring
bSetup=Cross(WaveTrend1,WaveTrend2);
sSetup=Cross(waveTrend2,WaveTrend1);
BuySetupValue = ValueWhen(bSetup,H,1);
SellsetupValue = ValueWhen(sSetup,L,1);
Longa = Flip(Bsetup,Ssetup);
shrta = Flip(Ssetup,Bsetup);
Buy1 = Longa AND Cross(C,BuySetupValue);
Sell1 = shrta AND Cross(SellsetupValue,C);
Buy1 = ExRem(Buy1,Sell1);
Sell1 = ExRem(Sell1,Buy1);
shape=Buy1*shapeUpArrow+Sell1*shapeDownArrow;
PlotShapes( shape, IIf( Buy1, colorWhite, colorYellow ), 0, IIf( Buy1, L-1, IIf(Sell1,H+1,Null)));
Buy2=Close>EMA(Close,50);
Sell2=Close<EMA(Close,50);
Buy2 = ExRem(Buy2,Sell2);
Sell2 = ExRem(Sell2,Buy2);
shape=Buy2*shapeUpArrow+Sell2*shapeDownArrow;
PlotShapes( shape, IIf( Buy2, colorGreen, colorRed ), 0, IIf( Buy2, L-1, IIf(Sell2,H+1,Null)));
Buy=Buy1 AND Buy2;
Sell=Sell1 AND Sell2;
shape=Buy2*shapeUpArrow+Sell2*shapeDownArrow;
PlotShapes( shape, IIf( Buy, colorGreen, colorRed ), 0, IIf( Buy, L-1, IIf(Sell,H+1,Null)));
_SECTION_END();
_SECTION_BEGIN("EMA1");
P = ParamField("Price field",-1);
Periods = Param("Periods", 15, 2, 300, 1, 10 );
Plot( EMA( P, Periods ), _DEFAULT_NAME(), ParamColor( "Color", colorCycle ), ParamStyle("Style") );
_SECTION_END();
i have attached chart image here for easy reference. in that chart when price close below or above 50 EMA and Wavetrend Crossover come in a same candle then buy and sell signal triggers.
white and yellow is for re-entry for buy or sell.
BUT What i Rquired is
buy IF : Close Above 50 EMA And LATER it has Positive WaveTrend Crossover
buy IF : Positive WaveTrend Crossover and Later Price Close Above 50 Ema its A buy
buy exit : if Price is Above 50 Ema and Negative Wavetrend Crossover comes its a long exit only.
Buy Re-Entry : if Price is above 50 Ema and positive corssover comes its a buy or buy Re-Entry.
For Sell all condition is reversed. if i get buy codes i will write sell coding with help of that..
if you can help me with this formula and condition it will be very much helpful for me. I spent lot of time but didn't get desired outcome. searched a lot and tried many codes and condition but error never goes.
plz help me with this..
Thanx Friends,
Chetan
Attachments
-
 28.2 KB Views: 157
") ..
..