EURGBP Technical Breakdown and Fundamental Impacts
The EUR GBP forex pair, commonly referred to as “Chunnel,” represents the exchange rate between the Euro and the British Pound. This pair is a crucial indicator of economic relations between the Eurozone and the United Kingdom, making it a popular choice among forex traders. In today’s context, the EURGBP forex pair is influenced by various upcoming economic events and fundamental factors.
Fundamentally, the EUR/GBP pair might experience subtle fluctuations due to the low-impact economic news from the Eurozone. The Italian Industrial Production m/m is forecasted to grow by 0.3%, and a higher-than-expected figure could slightly strengthen the Euro. Similarly, the Sentix Investor Confidence index, with a forecast of -1.5, if it exceeds expectations, could boost investor sentiment towards the Euro. Additionally, a speech by German Buba President Joachim Nagel could provide insights into future ECB monetary policy, potentially affecting the Euro’s strength. However, given the low impact expected from these events, significant volatility is not anticipated unless there are unexpected remarks or data.

Chart Notes:
• Chart time-zone is UTC (+03:00)
• Candles’ time-frame is 4h.
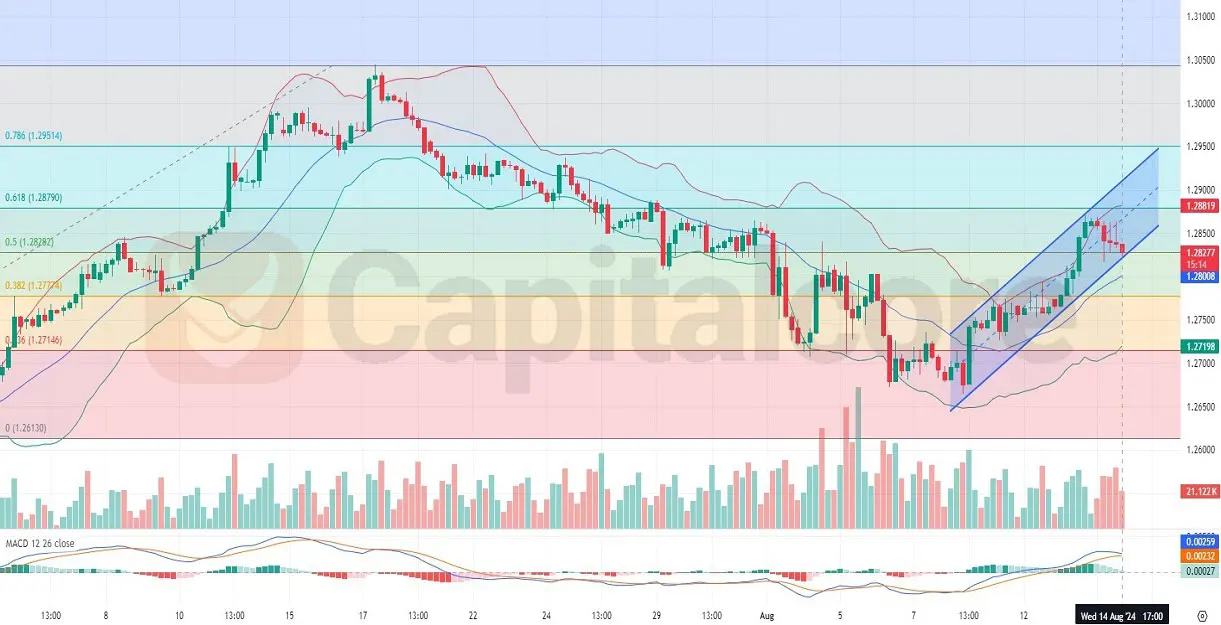
Analyzing the EUR/GBP H4 chart price, the recent candlestick patterns reveal a strong bearish momentum. The last five candles have moved sharply from the middle Bollinger Band towards the lower band, with the last three candles touching the lower band, indicating increased selling pressure. The Bollinger Bands have widened significantly, reflecting heightened market volatility and further bearish sentiment in EUR-GBP price. Additionally, the MACD indicator shows the MACD line crossing below the signal line, reinforcing the bearish trend. This technical setup suggests that the EUR/GBP pair is likely to continue its downward movement in the near term, barring any major fundamental shifts.
Capitalcore
The EUR GBP forex pair, commonly referred to as “Chunnel,” represents the exchange rate between the Euro and the British Pound. This pair is a crucial indicator of economic relations between the Eurozone and the United Kingdom, making it a popular choice among forex traders. In today’s context, the EURGBP forex pair is influenced by various upcoming economic events and fundamental factors.
Fundamentally, the EUR/GBP pair might experience subtle fluctuations due to the low-impact economic news from the Eurozone. The Italian Industrial Production m/m is forecasted to grow by 0.3%, and a higher-than-expected figure could slightly strengthen the Euro. Similarly, the Sentix Investor Confidence index, with a forecast of -1.5, if it exceeds expectations, could boost investor sentiment towards the Euro. Additionally, a speech by German Buba President Joachim Nagel could provide insights into future ECB monetary policy, potentially affecting the Euro’s strength. However, given the low impact expected from these events, significant volatility is not anticipated unless there are unexpected remarks or data.
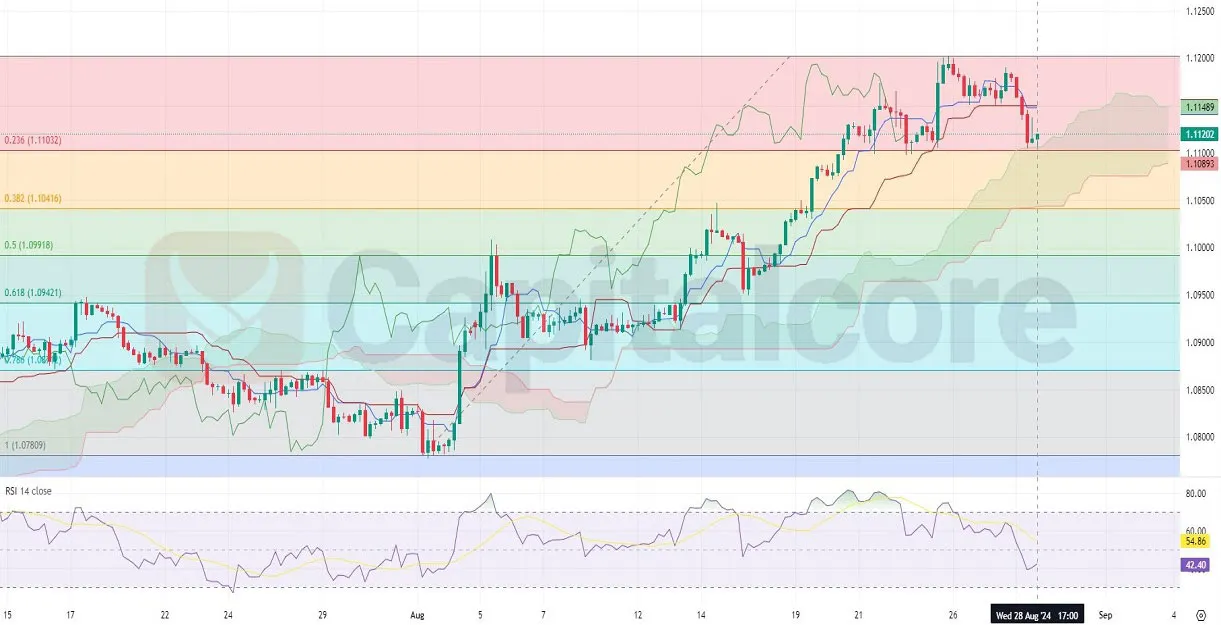
Chart Notes:
• Chart time-zone is UTC (+03:00)
• Candles’ time-frame is 4h.
Analyzing the EUR/GBP H4 chart price, the recent candlestick patterns reveal a strong bearish momentum. The last five candles have moved sharply from the middle Bollinger Band towards the lower band, with the last three candles touching the lower band, indicating increased selling pressure. The Bollinger Bands have widened significantly, reflecting heightened market volatility and further bearish sentiment in EUR-GBP price. Additionally, the MACD indicator shows the MACD line crossing below the signal line, reinforcing the bearish trend. This technical setup suggests that the EUR/GBP pair is likely to continue its downward movement in the near term, barring any major fundamental shifts.
Capitalcore