


Hello All") ,
,
I was reading 'Teach a man to fish' by saint, it was awesome :clapping: and also was going through some TA stuff..
I don't understand the need to have support,Resistance and trend-lines in one chart.
Doesn't all three refers to the same concept i.e uptrend or downtrend.
In sideways market it makes more sense to draw support ad resistance isn't ?
I am confused.
Also one more question.
I just read about the Point and Figure charts. Isn't more easier to draw these trend-lines on it rather than a candle or bar chart? or Does it have any kind of drawback?
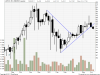
Could you please see if the uptrend and downtrend line that i have drawn for lupin is right ?
Sorry for my noob questions. I am totally new to trading.
Thanks,
chaksashi:gunsmilie:
,I was reading 'Teach a man to fish' by saint, it was awesome :clapping: and also was going through some TA stuff..
I don't understand the need to have support,Resistance and trend-lines in one chart.
Doesn't all three refers to the same concept i.e uptrend or downtrend.
In sideways market it makes more sense to draw support ad resistance isn't ?
I am confused.
Also one more question.
I just read about the Point and Figure charts. Isn't more easier to draw these trend-lines on it rather than a candle or bar chart? or Does it have any kind of drawback?
Could you please see if the uptrend and downtrend line that i have drawn for lupin is right ?
Sorry for my noob questions. I am totally new to trading.
Thanks,
chaksashi:gunsmilie:
Attachments
-
 26.4 KB Views: 50
Last edited: