


This is merely a trendline analysis based on support and resistance levels. I don't even trade cryptocurrencies but this chart looked so perfect for an analysis so I though I would share it with you guys. My guess is the bearish is taking over and the price could drop to $55K but the problem is currently it's still not clear and it's so close to the support line but the break through is most possible. Hope you guys like it. Tell me what you think about them.
Please ask me if anything I drew is unclear.
Please ask me if anything I drew is unclear.
Attachments
-
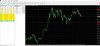 460.9 KB Views: 32
 -
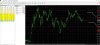 474.5 KB Views: 27
 -
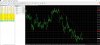 470.7 KB Views: 23
 -
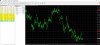 473.3 KB Views: 18
 -
 473.7 KB Views: 17